Application Performance Monitoring tools help teams track how software actually behaves in production so they can detect, diagnose, and fix performance issues before users feel them. In 2026, APM has largely converged with broader observability practices that combine traces, metrics, logs, and events to explain what is happening across applications, services, and infrastructure. Gartner defines observability platforms as products that ingest telemetry from multiple sources and enable analysis to identify behavior changes that impact end user experience, including outages and performance degradation. This matters because downtime and degradation have become materially expensive, with recent reporting citing outage impacts that can reach $1 million to $3 million per hour for many organizations.
Below is a top tools list summarizing leading Application Performance Monitoring tools with key features and other information to help you evaluate options.
1. Dynatrace
Dynatrace is an Application Performance Monitoring tool that offers software intelligence services to assist customers in simplifying cloud complexity and speeding up digital transformation. Their all-in-one platform provides accurate answers regarding the performance and security of applications, the underlying infrastructure, and the experience of all users with automatic and intelligent observability at scale. This enables the organizations to innovate faster, collaborate more efficiently, and deliver more value with dramatically less effort.
Key Features:
-
Performance monitoring
-
Database monitoring
-
Automation
-
Activity monitoring
Cost:
The full-stack monitoring starts at $69 per month. The infrastructure monitoring starts at $21 per month. The digital experience monitoring starts at $11.
2. App dynamics

AppDynamics, powered by Cisco, is a Application Performance Monitoring tool developed with a mission to help businesses understand their technology through the lens of business so that they can work together to prioritize what matters most. The AppDynamics Business Observability Platform helps companies to flourish at a faster rate in this era of unprecedented digital growth. This they do by delivering business context deep into the technology stack, uniting teams around common goals, and empowering engineers to act with confidence and control.
Key Features:
-
Real user monitoring
-
Artificial Intelligence
-
Machine learning
-
Proactive identification
-
Resolution guidance
Cost:
Users can request quotations from the website.
3. Datadog

Datadog is a cloud-based monitoring, security, and analytics tool for developers, IT operations teams, security engineers, and business users. To enable unified, real-time observability of their clients' whole technological stack, this SaaS tool helps in unifying and automating infrastructure monitoring, application performance monitoring, and log management.
Key Features:
-
Monitoring
-
Alerting
-
Data visualization
-
API monitoring
-
Dashboards and visualizations
Cost:
The pro plan starts from $15 per host/per month. The enterprise plan costs $23 per host/per month.
4. Alert Site

The Alert Site provides a platform for synthetic monitoring of mission-critical apps and APIs. It provides a 360-degree perspective of your application's performance as experienced by the end-user.
AlertSite understands what failure means to you and when you need to know about it, thanks to the simplest, most robust setting techniques ever. AlertSite has a monitor and alert settings that allow you to be more specific with your choices without requiring sophisticated installations.
Key Features:
-
Proactively monitors mobile websites and applications
-
Faster warnings and faster resolutions
-
Monitors both API endpoints and chained Records web interactions step by step
Cost:
Users can request quotations from the website.
5. Instana

The Enterprise Observability Platform from Instana, is driven by automated Application Performance Monitoring. This tool automatically detects and maps all services, infrastructure, and interdependencies.
Instana ingests all observability metrics, traces each request, profiles each process, and updates application dependency maps in real-time to provide Dev+Ops with the context and actionable feedback they need to optimize application performance, enable innovation, and mitigate risk, allowing them to add value and efficiency to the pipeline.
Key Features:
-
Monitoring of Usage
-
Dashboards and Visualizations for Database Monitoring
-
Forecasting and Optimization of Spend
Cost:
The application performance Management costs up to $75 per host/per month billed annually.
6. Stackify

Stackify is a cloud-based platform that provides new APM solutions to software developers, operations, and support management. It enables monitoring and troubleshooting of cloud-based apps as well as DevOps visibility.
Key Features:
-
SaaS-based
-
Finds bugs during development and testing.
-
Error and log handling are integrated.
-
Troubleshoot manufacturing issues
-
Designed with developers in mind
Cost:
Users can request quotations on the company’s website.
7. Log Rocket

Log Rocket integrates session replay, performance monitoring, and product analytics to enable software teams to provide the best product experience possible. Engineers may use the solution to monitor the new or existing components of apps for difficulties, replicate user-related problems, and obtain videos and logs for bug reports.
Key Features:
-
QA for APIs and Integrations
-
Performance and Reliability Testing
-
Management of Users, Roles, and Access
Cost:
The company provides 1000 free sessions per month and after that, there are different packages like Team, Professional which cost from $99 per month to $500 per month. Apart from this, the enterprise plan is customizable.
8. Progress WhatsUp Gold

Progress WhatsUp Gold enables you to detect and resolve network issues quickly – frequently before the end, users notice, which is the holy grail of IT. Its one-of-a-kind, interactive mapping interface allows you to examine up/down availability and performance for anything connected to your network at a glance. Drag-and-drop dashboards make it simple to examine the precise condition and performance of any device, whether on-premise or in the cloud.
Key Features:
-
Performance Evaluation
-
Notifying Suggestions for Improvement
-
Possess the capability for managing Multiple Networks
-
Scalability of Network Visibility
Cost:
The company provides free trials to their users and after that customized quotations are made.
9. Solar Winds Server and Application Monitor

SolarWinds Server & Application Monitor is a low-cost and simple-to-use system monitoring tool that gives detailed insight into application and server performance concerns. One can discover their system's surroundings automatically and begin monitoring in minutes with the help of this tool.
Key Features:
-
Typically, users can get started in minutes.
-
Monitors 1,200+ out-of-the-box monitoring templates for Azure and AWS IaaS, PaaS, and SaaS, as well as over 1,000 community templates
-
Uses REST API, WMI, SNMP, and PowerShell scripts for customized monitoring
-
Customizable server monitoring
-
Mapping infrastructure dependencies
Cost:
Beginning at $1,663.
10. Sumo Logic

Sumo Logic has pioneered continuous intelligence in a new category of software that helps enterprises of all sizes to manage the data problems and possibilities posed by digital transformation, contemporary apps, and cloud computing. The Sumo Logic Continuous Intelligence PlatformTM automates the collection, ingestion, and analysis of application, infrastructure, security, and IoT data to generate actionable insights in seconds.
Key Features:
-
Reports on Incidents Resolved by Automation
-
Log Management
-
Workflow Management
Cost:
The professional plan costs up to $90/month and for an enterprise plan, users have to directly contact the company.
11. Epsagon

Epsagon enables teams to see, understand, and improve their microservice designs in real-time. Gaps in data and manual effort associated with competing APM systems are removed by unique lightweight auto-instrumentation. IT professionals might also additionally use Epsagon's included software program improvement kit (SDK) to look at all payloads or fields in real-time and spot person transactions.
Key Features:
-
Increases development velocity while decreasing application downtime.
-
Reductions in issue detection
-
Root cause investigation
-
Resolution times
Cost:
The pro plan costs up to $89/month which is billed annually. And for enterprise plans, users have to contact the company directly.
12. Catchpoint

Catchpoint is the market leader in enterprise-proven Digital Experience Observability, helping teams to confidently own the end-user experience. Fortune 500 organizations rely on Catchpoint's observability technology to proactively and promptly discover and correct problems before they negatively influence digital user experience.
Key Features:
-
Multi-Network Capability for Content Management
-
Performance Baseline
-
Alerting
Cost:
This product or service does not have a price listed by Catchpoint.
13. Fusion Reactor APM

Fusion Reactor helps you quickly identify bottlenecks in your code and database, allowing your application to function quicker and more efficiently. If you are operating a monolithic server, It has an on-premises APM platform. Similarly, if you are running a distributed system or containerized environment, the tool also possesses a Cloud (SaaS) platform for this purpose.
Key Features:
-
Real-Time Analytics Alerts and Notifications Monitoring
-
Visualization and Dashboards
-
A single sheet of glass
Cost:
The developer plan costs up to $19/month. The standard plan costs up to $39/month. The enterprise plan costs up to $59/month and the ultimate plan $79/month.
14. Microsoft System Center

By providing unified administration, Microsoft System Center assists clients in realizing the benefits of the Microsoft Cloud Platform. With out-of-the-box monitoring, provisioning, configuration, automation, protection, and self-service, you can be up and running quickly.
Key Features:
-
Asset Tracking Analytics and Reports
-
Workflow Process
-
Change Management in Performance Logging
-
Administration Console
Cost:
This product or service's pricing has not been supplied by Microsoft System Center.
15. Centreon

Centreon is a network, system, application monitoring, and supervision tool. It is one of the most versatile and powerful monitoring software available. The tool is completely free and is open source.
Key Features:
-
Supervision of hybrid infrastructures from beginning to conclusion
-
Architecture that is open and adaptable to your needs.
-
The open-source solution that may be downloaded for free
Cost:
This product or service does not have a price listed by Centreon.
16. Instabug
By capturing all the logs causing crashes and performance difficulties, Instabug's SDK enables over 2 billion mobile developers to identify, evaluate, and repair any app performance, quality, or stability issues.
Key Features:
-
Feedback Gathering
-
User Reported Issues & Suggestions
-
Data Retention for Bug History
-
Timely Notifications
-
User Reports and Comments
-
DejaClick is an easy-to-use, seamless plug-in for capturing web transactions and user journeys.
-
Website monitor scripts, online and mobile application monitor scripts may be created using a point-and-click interface.
-
Creating a Native API Monitor
Cost:
The basic plan costs up to $149 per month. The pro plan costs up to $249 per month. The premium plan needs users to contact the company and can also book a demo.
17. Veeam One

Veeam ONE, which is a component of the Veeam Availability Suite, offers a complete monitoring and analytics solution for backup, virtual, and physical environments. Through interactive tools and intelligent learning, Veeam ONE provides deep, intelligent monitoring, reporting, and automation, finding and resolving actual customer problems before they become serious issues. Veeam continues to focus on developing critical tools that guarantee enterprises like yours have total visibility into their backup infrastructure as well as the operational aspects of their backup and recovery operations.
Key Features:
-
Reporting & Monitoring
-
Chargeback and capacity planning
-
Automation and diagnostics that are intelligent
Cost:
Pricing information for this product or service has not been supplied by Veeam ONE.
18. Scout APM

Scout APM is application performance monitoring that simplifies troubleshooting by assisting developers in identifying and resolving performance issues before consumers see them. This tool helps its users to easily and quickly monitor performances. Scout APM examines increasing response time using user-friendly dashboards that allow you to dive down into particular endpoints, requests, pathways, and users associated with your slowdowns.
Key Features:
-
Scout APM is application performance monitoring that simplifies troubleshooting
-
Assists developers in identifying and resolving performance issues before consumers see them.
Cost:
The basic plan costs up to $129/month, plus plan costs up to $199/month, the pro plan costs up to $399/month.
19. Atatus
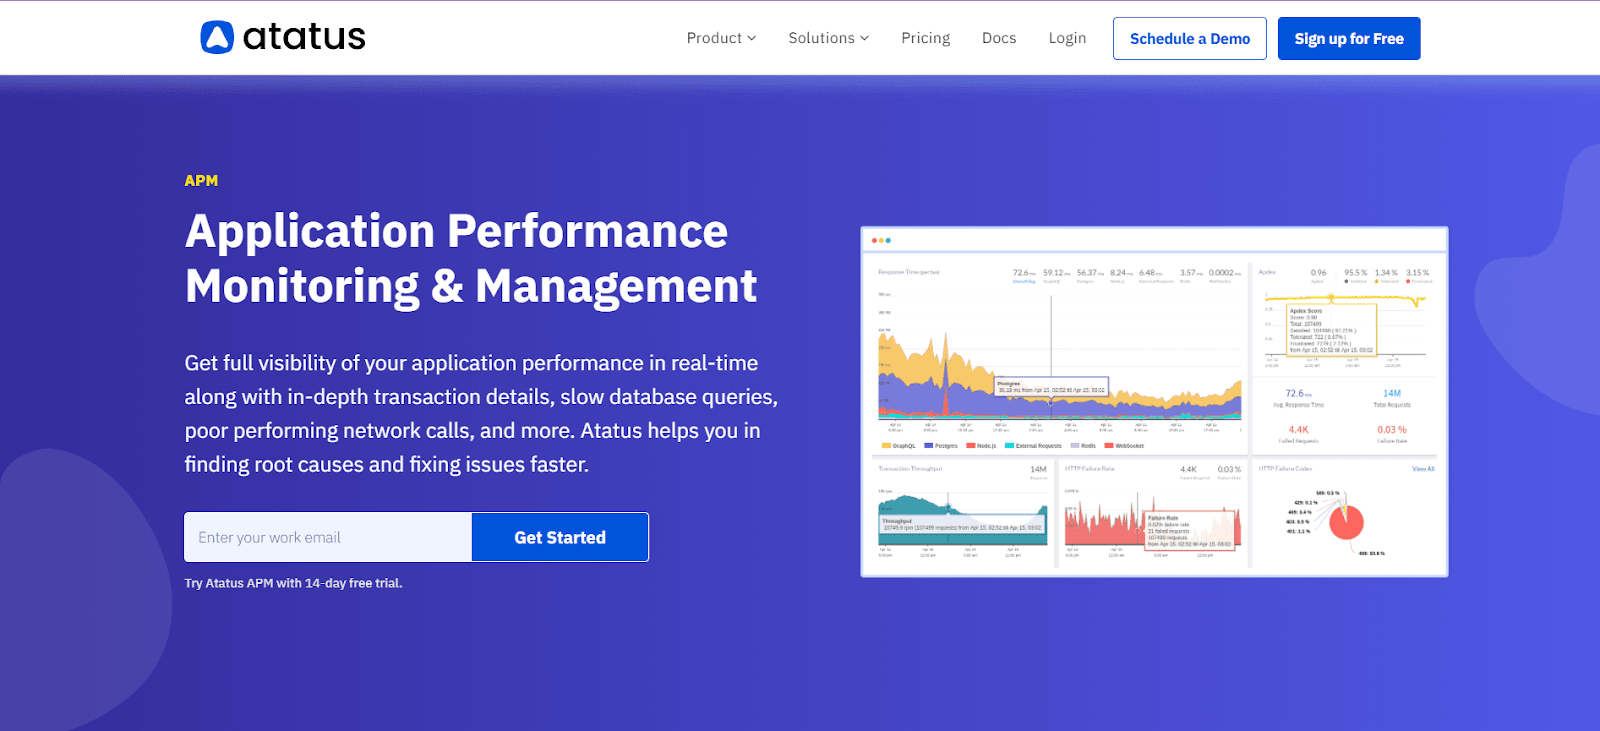
Atatus, which is derived from the phrase App Status, is a technology firm that creates observability platforms for developers all around the world. Atatus guarantees that your teams get a comprehensive view of all the performance indicators required to produce high-quality, dependable software. From staging to production, this tool provides the insight that you need for monitoring and managing your businesses online. The tool was developed with the objective to deliver a better experience for its users which it has been successful to achieve so far.
Key Features:
-
Monitors the health of your applications and receives notifications when your customers encounter problems.
-
Apdex scores may be used to assess frontend and backend performance as well as user happiness (Application Index)
-
Resolves any performance or availability concerns before they affect your consumers.
-
Transparency helps to build trust.
Cost:
Users can request a quotation on their website.
20. PRTG Network Monitor

PRTG Network Monitor is a real-time unified infrastructure monitoring solution that helps IT professionals to discover and address problems across their entire network before they escalate and become business-critical.
Key Features:
-
Performance Monitoring
-
Alerting
-
Suggestions for Improvement
-
Capability for Multiple Networks
-
Visualizations and dashboards
Cost:
PRTG 500 costs up to $1,750, PRTG 1000 costs up to $3,200, PRTG 2500 costs up to $6,500, PRTG 5000 costs up to $11,500.
21. Lumigo

Lumigo is the top platform for serverless Application Performance Monitoring. Lumigo's one-click distributed tracing enables developers to quickly identify and resolve issues in serverless and microservices settings.
Key Features:
-
Monitoring of Usage
-
Cloud Infrastructure Dashboards
-
Visualizations - Real-Time Monitoring
Cost:
The company provides a custom quotation to all its users.
22. Logz.io
Logz.io is a leading cloud-native observability platform that enables developers to use the greatest open-source tools available without the difficulty of running, administering, and growing them. Logz.io provides four products: ELK-based log management, Prometheus-based infrastructure monitoring, Jaeger-based distributed tracing, and an ELK-based cloud SIEM.
Key Features:
-
Monitoring of Activity
-
Response Automation
-
Examining Data
-
Information Sources
Cost:
The Log Management-Pro plan cost up to $1.84/month, the infrastructure monitoring plan cost up to $12/month, distributed tracing cost up to $5 per million spans, per month.
23. Rollbar

With Rollbar's continuous code improvement platform, you can detect, forecast, and resolve mistakes in real-time. Rollbar provides complete coverage for all of the applications on which your users rely and enjoy. With the aid of Rollbar, you can automate real-time problem response, resulting in happier customers and more productive development teams.
Key Features:
-
User Reported Issues & Suggestions
-
History of Bugs
-
Constant Watching
-
Timely Notifications
-
Retention of Data
Cost:
The essential plan costs up to $21/month, the advanced plan costs up to $82/month, and an enterprise plan for which quotation has to be requested.
24. ManageEngine Applications Manager

ManageEngine Applications Manager is an enterprise-ready, user-friendly, and cost-effective application management solution that enables businesses to successfully monitor mission-critical applications and data centers.
Key Features:
-
Solution for Integrated Application and Server Management
-
Reduced Total Cost of Ownership (TCO) due to no further software purchases.
-
Solution for Agentless Monitoring
-
Meeting Service Level Agreements in Business Service Management (SLAs)
-
Improves service accessibility and efficiency.
-
Take a step back and look at your business application as a whole.
Cost:
This product or service's pricing has not been disclosed by ManageEngine Applications Manager.
25. Serverless 360

Serverless360 is an enterprise-standard platform with the capability of serving as a strong Azure support solution.
Key Features:
-
Azure Documenter
-
Business activity monitoring
-
A sophisticated toolkit for day-to-day operating requirements.
-
Automate difficult activities to eliminate the need for manual intervention.
-
Message monitoring from beginning to end across Integrations
-
Create Azure documentation in minutes.
-
Examine user activities on Serverless360 entities.
-
Choose between SaaS and Private Hosting as your hosting model.
Cost:
This product or service does not have a price listed by Serverless360.
26. Pulse Secure Virtual Traffic Manager

Pulse Secure Virtual Traffic Manager is a software-based application delivery controller (ADC) that is aimed to provide a quicker, more reliable user experience with access to public websites and business applications.
Key Features:
-
Application delivery controllers (ADCs)
-
Improves load-balancing
-
Reliability
-
Availability and security
Cost:
This product or service's pricing has not been supplied by Pulse Secure Virtual Traffic Manager.
27. Germain APM
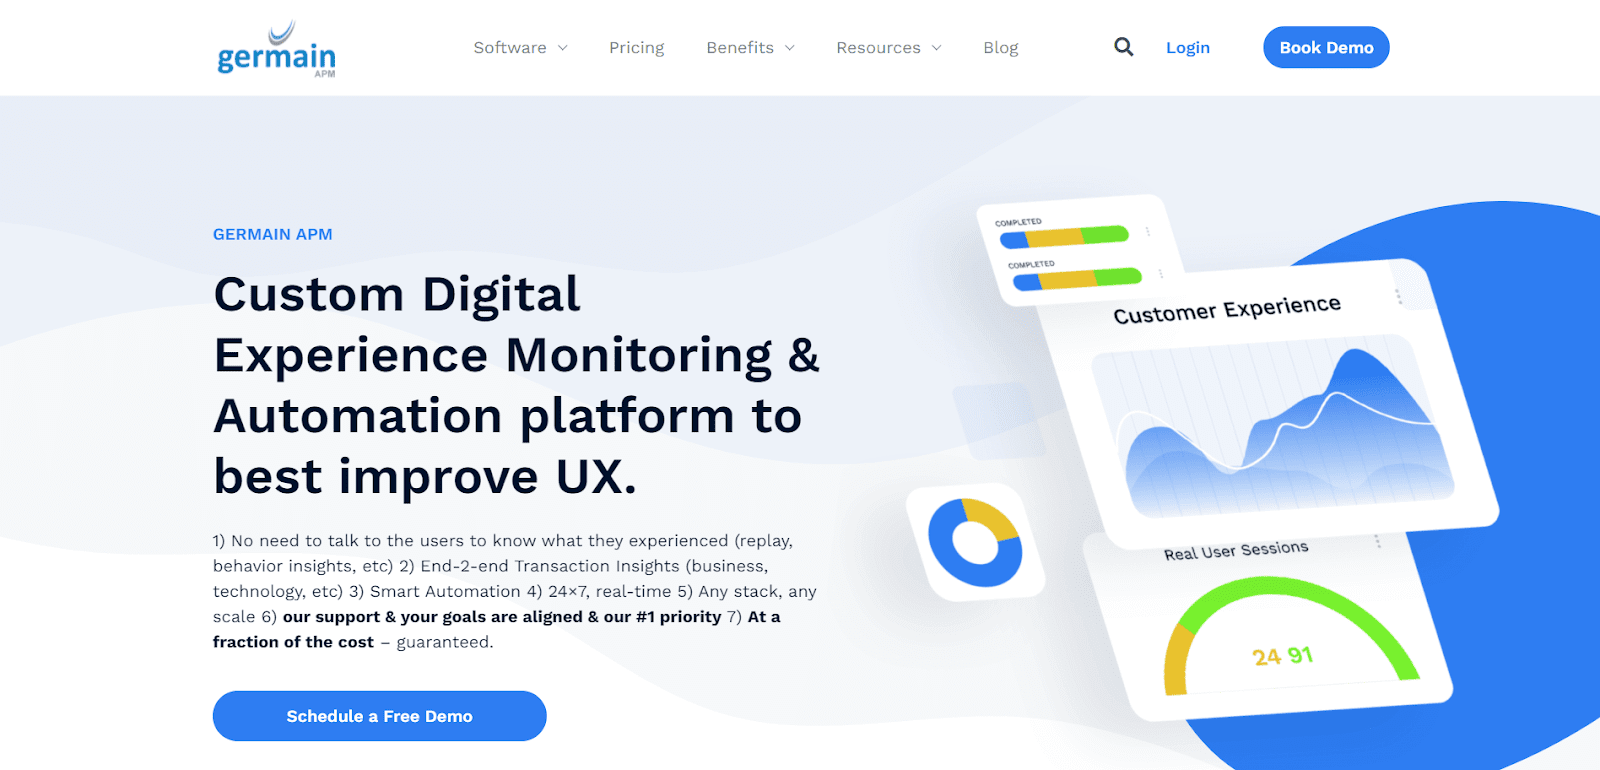
Germain APM is a cloud-based and on-premise solution that is meant to assist enterprises in areas such as banking, healthcare, media, retail, telecommunications, and others. The tool helps in doing root cause analysis to monitor application and server performance.
Key Features:
-
User Behavior Insights from Real User Session Video Recording/Replay
-
Monitoring/Insights into Processes and Monitoring/Insights into Technology
-
Proactive Problem Detection (via synthetic and prediction)
-
Alerting and automatic issue resolution (through automation).
Cost:
The starter plan will cost up to $460/month with 1 million APM units/day and by paying $11,995 you can avail of unlimited APM.
28. Splunk APM

Splunk APM can collect traces and spans to monitor your distributed applications. A trace is a set of operations, or spans, that take place to complete a transaction. Splunk APM gathers and analyses every span and trace from every service you've linked to Splunk Observability Cloud to provide you with full-fidelity access to all of your application data.
Key Features:
-
Enhances the user experience. Finds and solves problems on web pages and native mobile apps more quickly.
-
Troubleshooting is easier and faster. By integrating trace data, visibility into code-level performance, and advanced analytics, you can rapidly identify the core problem.
-
Instrumentation based on Open Telemetry.
Cost:
The standard plan by Splunk costs $55 per host monthly and the enterprise plan costs around $85 per host monthly.
29. Google Cloud Console

The Google Cloud Console is a web-based, graphical user interface for managing Google Cloud projects and resources. When you use the Cloud Console, you either create a new project or choose an existing project, and then you use the resources that you generate in that project's context.
Key Features:
-
Its on-demand services include web-based tools in an automated environment.
-
With wide network access, the resources and information may be accessed from any location.
-
The resource pooling feature allows the provision of a shared pool of computer resources to users on an as-needed basis.
Cost:
Users can request quotations from the website.
30. Intel VTune Amplifier

VTune Amplifier captures important profile data and shows it in a comprehensive interface that simplifies analysis and understanding.
Key Features:
-
Analysis of hotspots
-
Threading examination
-
Remote examination
-
Container/in/out analysis
-
Eclipse/Visual Studio IDE
-
Analysis of HPC Performance Characterization
Cost:
This product or service does not have a price listed by Intel VTune Amplifier.
31. Site 24x7

Site24x7 APM Insight is an application performance monitoring solution that assists you in optimizing your application's performance in real-time. You can understand your application behavior and bridge the gap between end-user experience and application performance with Site24x7 APM Insight, resulting in a seamless digital experience for your consumers.
Key Features:
-
AI-powered application performance monitoring (APM) technology allows you to proactively spot abrupt increases in application performance.
-
Recognizes how your apps link to and communicate with third-party components.
-
Allows you to effortlessly troubleshoot across microservices and distributed architecture.
-
Real-time monitoring of crucial business transactions
Cost:
The starter plan costs $7.17/month, the pro plan costs $27.36/month, the classic plan costs $69.70/month, the elite plan costs $175.22/month, and the enterprise plan cost $351.10/month.
32. New Relic

New Relic is a SaaS-based application performance management (APM) solution. It is one of the most effective application performance monitoring tools, including APM for mobile apps, advanced browser monitoring, and infrastructure monitoring.
Key Features:
-
Tracks down the SQL statements that are causing slow performance.
-
Provides an overview of performance trends.
-
SQL Query Analysis is possible.
-
Provides early warnings
-
Code-based diagnostics
-
Tracing of Cross-Applications
Cost:
Users can request quotations from the website.
33. Foglight
 Foglight is an APM solution that monitors, manages, and improves database and virtual infrastructure performance. This tool solves all these problems. It enables you to build a tailored APM solution for end-to-end management. This tool is highly instrumental in overcoming certain challenges such as limited expertise in the virtualization platforms and diversity in technical infrastructures. Once workloads have been transferred, you must verify that they are performing properly, decreasing the risk of downtime and keeping the business running smoothly. To deliver a comprehensive performance solution, Foglight's capabilities extend beyond hybrid settings. The tool may be used by several operations teams to diagnose, rectify, and avoid issues while working more efficiently.
Key Features:
-
Monitoring and diagnostics for application servers
-
Dashboards and SLA monitoring
-
Transaction Logging
-
Performance Investigator (available for Oracle, SQL Server, and MySQL)
-
Keep track of your middleware environment.
-
Chooses items based on a technological platform.
-
Increase compliance with end-user service level agreements (SLAs).
Cost:
The cost begins at $499 /year.
34. BMC Compuware APM

BMC Compuware APM solution uses artificial intelligence (AI) to assist businesses and application owners, support, and developers in managing the performance of mission-critical applications.
Key Features:
-
Normal performance on a trend and baseline basis
-
Priorities should be established depending on the severity or degree of the impact. Code-level diagnostics
-
SQL statements are precisely monitored.
Cost:
Users can request quotations from the website.
35. JenniferSoft APM

Jennifer is a solution for real-time application monitoring. This APM tool can collect and track real-time transactions from start to finish. It enables you to monitor with little burden on several platforms such as Java,.Net, and PHP.
Key Features:
-
Monitoring in real-time
-
Dashboard in real-time and topology view
-
Cloud Environment Support
-
Web-based Service Monitoring in Real-Time
Cost:
For price information, please contact JENNIFERSOFT.
36. ExtraHop

With real-time analytics, ExtraHop makes data-driven security and IT operations a reality. In a streamlined delivery system, this APM tool also gives insight into application servers, databases, storage systems, and the whole network. To achieve the best performance, the tool provides total visibility and rapid reaction times.
Key Features:
-
Dashboards with intuitive interfaces
-
Customized, one-click reports
-
Performance evaluation that is objective
-
Device finding and categorization are performed automatically.
-
Improved application response time
-
Activity maps for applications
Cost:
The new EH1000v subscription pricing is based on a flat-rate yearly subscription cost of $7,428 in North America for a basic system.
37. AppEnsure

Every application in every location is discovered, named, and mapped using the AppEnsure APM tool. It automatically analyses reaction time and provides cause analysis with event correlation with little to no setting.
Key Features:
-
Apps are monitored in every area.
-
Measures the response time of the app to the supporting infrastructure and sends an alert if the response time exceeds predefined parameters.
-
Cause-and-effect analysis with event correlation
-
Topology and the finding of events
Cost:
The per CCU will cost you around $5/month-$1/month. The server agent will cost around $10/month-$50/month. The endpoint agent will cost $1/month-$5/month.
38. Servicenow

The ServiceNow Service Performance Monitoring solution (APM) assists you in keeping your applications running at top performance by mapping business services to apps, servers, networks, and storage. This tool offers insights into the overall health of business services. The company was started in 2004 with a vision to build a cloud-based platform that would enable regular people to route work effectively through the enterprise. ServiceNow delivers digital workflows that create great experiences for its customers.
Key Features:
-
Maps business services to servers, apps, and other components by correlating monitoring and event data
-
Service technology discovery in real-time
-
Monitors are automatically deployed to collect data.
Cost:
Users can request quotations from the website.
39. Opsview
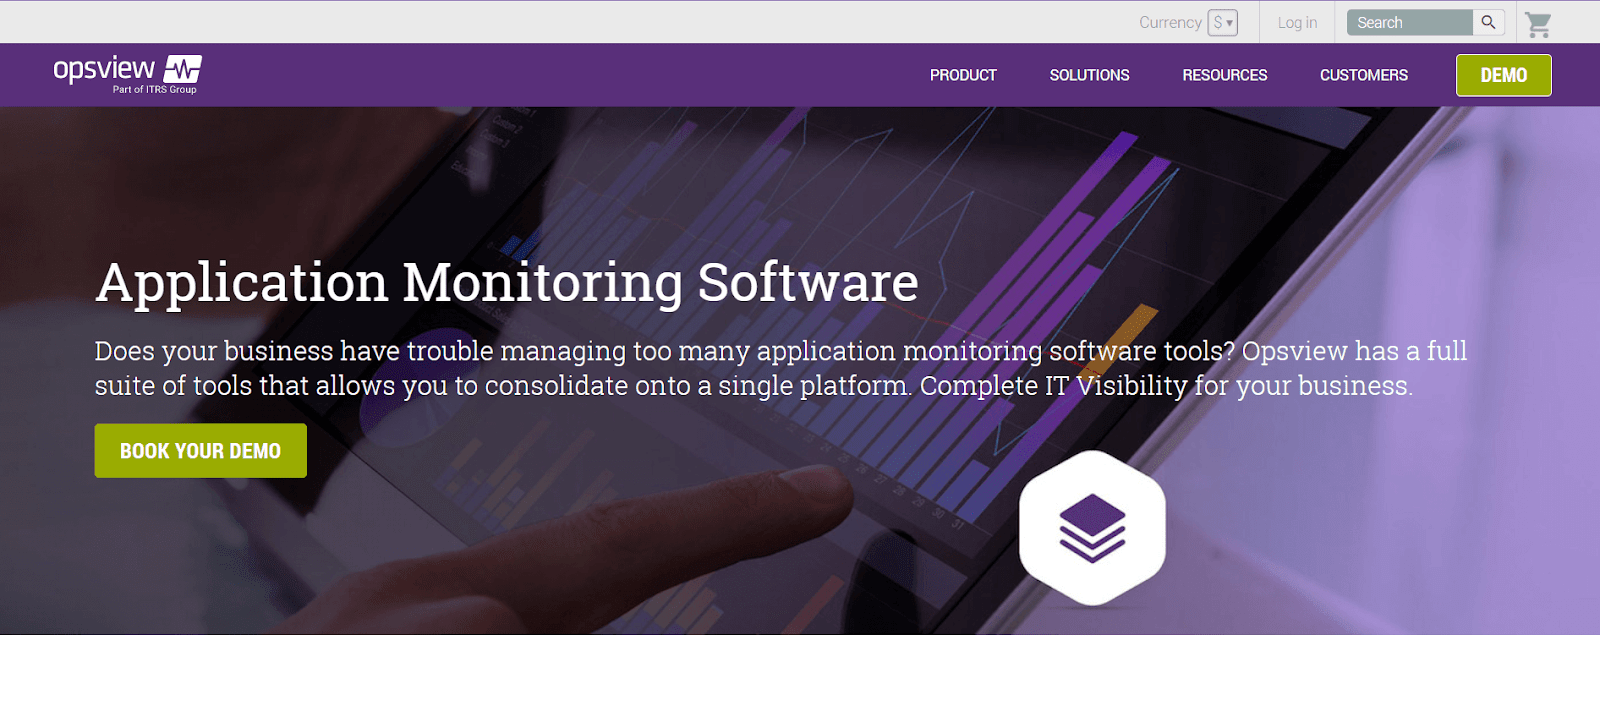
Opsview Monitor provides a single view of their changing IT operations. It might be on-premises, on the cloud, or a hybrid of the two. Opsview can monitor all of the applications that your website depends on. This includes performance-enhancing software like Varnish and all major databases.
Opsview can monitor all of the functions which highly influence your website. This covers web servers such as Apache and IIS, as well as all major databases and performance-enhancing technologies such as Varnish. Opsview can also monitor programs used by developers, such as Jenkins and Jira.
Key Features:
-
Automates and grows everywhere with a short time to value
-
Integrations of Business Service
-
Monitoring Notification Platforms
-
Service Desk Integrations
-
Pre-installed Notifications
Cost:
Users can request quotations from the website.
40. SevOne

SevOne, part of Turbonomic, is an IBM Company that provides modern monitoring and analytics solutions that organizations need to monitor their networks. SevOne meets the difficulty of application performance management by providing comprehensive visibility throughout the whole company network. It controls everything from on-premises software to cloud-based apps. The tool provides SaaS, public cloud, and on-prem offerings, including several pre-built solutions. It helps customers compete and win in the connected world by increasing their business agility and intensity of delivering new applications and services.
Key Features:
-
Dashboards and reporting in real-time
-
Alerts and proactive performance
-
The Application Performance Appliance (APA) is a device that translates packets into flow data.
-
End-to-end vision across several layers
-
Automatic creation of baselines
-
Reports are generated instantly.
Cost:
Users can request quotations from the website.
41. Virtana optimize
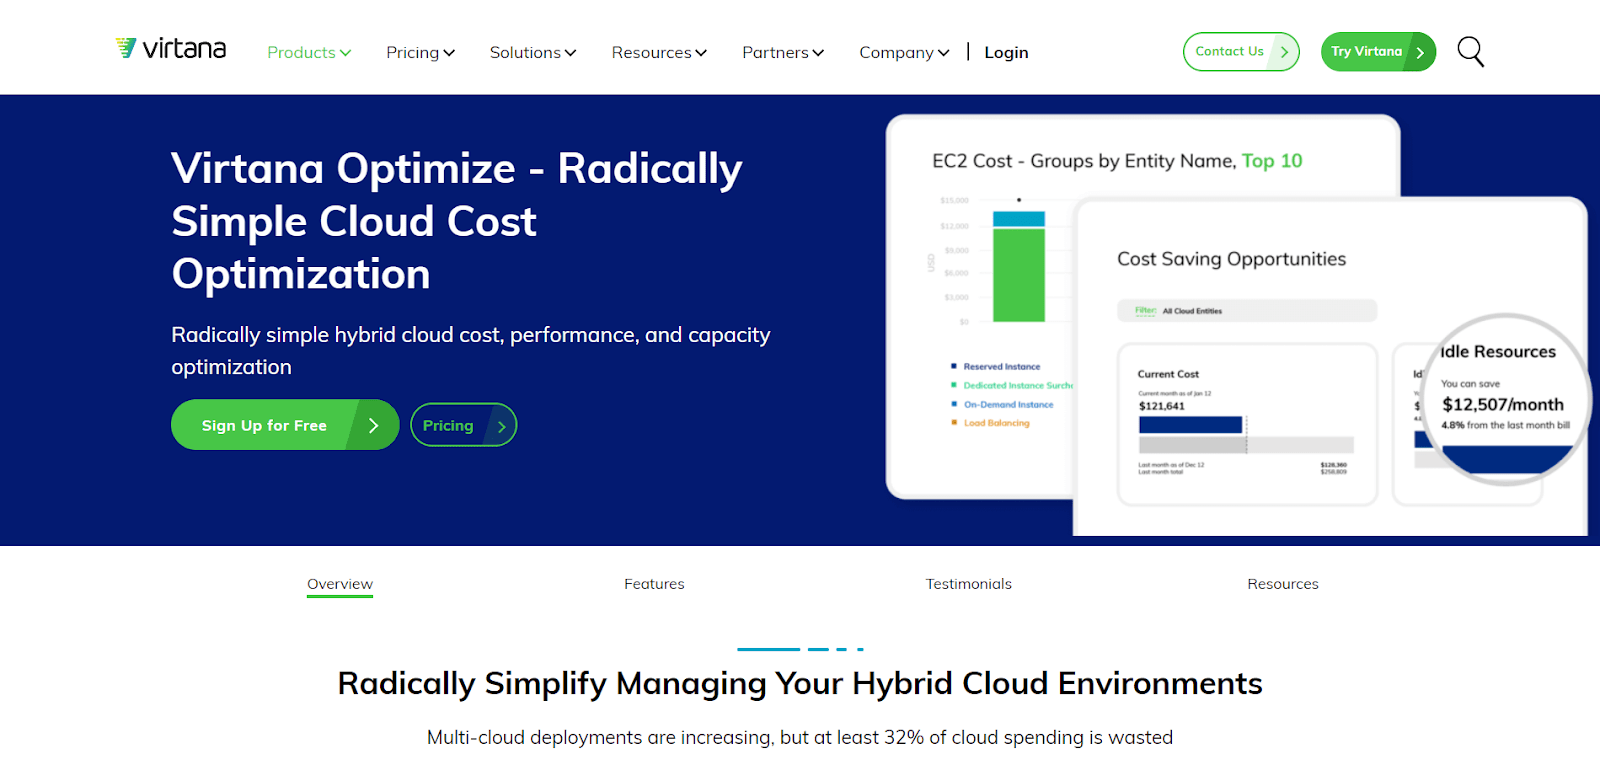
Virtana was founded in 2008 with a mission of delivering the highest quality infrastructure monitoring and analytics to the customers. Subsequently, more than 150+ global 2000 enterprise customers have come to be a part of their expertise in workload performance to solve their most critical IT performance and availability issues. When monitoring the performance of your cloud infrastructure and online applications, you may leverage machine learning and analytics with Virtana Optimize. It enables you to locate precise cost and usage statistics by grouping, filtering, and graphing. Virtana can also help you simplify your hybrid cloud management.
Key Features:
-
With open-source agents, metrics may be collected in a flexible, quick, and straightforward manner.
-
Pre-configured dashboards provide fast access to your analytics.
-
Complete accuracy through behavior learning Take your precision to new heights.
Cost:
Users can request quotations from the website.
42. Radware

Radware APM application monitoring tool gives total visibility into the performance of your applications. With real-time error detection and reaction time, this APM assists you in maintaining application performance and protecting your system. The tool allows you to monitor and detect application performance issues – before your customer does. Furthermore, this application monitoring provides historical reports with granular analysis based on user-defined SLA. It provides a bird's eye view which covers all applications, transactions, users, and data centers – allowing you to narrow down to the user, application, or transaction level.
Key Features:
-
Zero Deployment and Upkeep
-
Once a new application server is deployed, Radware APM automatically starts monitoring.
-
Application Monitoring Support for Internal and External Applications with Real User Experience
Cost:
Users can request quotations from the website.
43. Oracle Enterprise manager

Oracle Enterprise Manager is an all-inclusive Application Performance Management (APM) solution. E-Business Suite, Siebel, PeopleSoft, and Fusion Applications are all included in this tool, thereby improving its efficiency. The tool is designed for both cloud and enterprise data center deployments. Moreover, it is also supported on Oracle and non-Oracle platforms.
Key Features:
-
Monitoring of synthetic transactions
-
Tracking and tracing transactions and their occurrences
-
Monitoring and diagnostics for Java and databases
-
Keep an eye on the business KPIs that are provided in transaction content.
-
Oracle and non-Oracle systems Java and DB diagnostics
Cost:
Users can request quotations from the website.
44. INETCO Insight 7

INETCO Insight 7 detects transactional abnormalities such as EMV fallbacks or reversal rates, high withdrawal velocity, unusual amounts of high-value transactions, and suspected recurring card usage at specific ATM or POS terminal locations in real-time. The tool helps in improving risk scoring precision so real customers are not blocked from accessing their accounts. It also removes the common problem related with acquiring real-time data across disparate data stores.
Key Features:
-
Provides a unified picture of all banking channels
-
Capabilities for real-time data streaming and forwarding
-
Real-time warnings and continuous transaction monitoring
-
Transaction logs that may be searched, queried, and filtered
-
Increase the availability of all self-service devices.
Cost:
INETCO has not yet given price information.
45. Logic Monitor

Logic Monitor analyses, alerts and provides you graphs about all trends and events in a single resource for better application administration by tracing your applications' established data sources. This tool is known for its intelligent observability at an enterprise scale. It provides deep, real-time insights into the complexity of distributed, cloud-native applications. By precisely monitoring the system, the tool prevents outages, saves time and money, and protects brand reputation.
Key Features:
-
Enables you to operate with either Windows or Linux
-
Dashboards based on roles
-
Provides performance graphs
-
Receive notifications from any browser.
-
Email, SMS, and phone notifications
-
Alerts thresholds are predefined and adjustable.
-
Alerts distribution to particular groups
Cost:
Users can request quotations from the website.
46. Instrumental Application Monitoring

The Instrumental Application Monitoring tool can monitor applications, performance, and infrastructure. The tool assists you in collecting, visualizing, and transforming metrics throughout your whole infrastructure. The Instrumental Application Monitoring tool has got you all covered with its excellent features. Regardless of how large your IT infrastructure is, finding the right graph, alert, or dashboard is simple and fast with search-based navigation. In addition to being easy to understand, Instrumental's alerts are designed for maximum flexibility.
Key Features:
-
Monitoring of Automated Systems and Services
-
Data updated in real-time
-
In five minutes, you can set up a server monitoring agent.
-
Custom event overlays can be used to track deployments and application changes.
Cost:
The free plan of the Instrumental Application Monitoring tool includes up to 500 metrics and paid plans are typically less than $50/month. You can even fine-tune your metric usage by adjusting the AWS regions, services, and metrics you want to monitor.
47. Lumen Managed Network Services
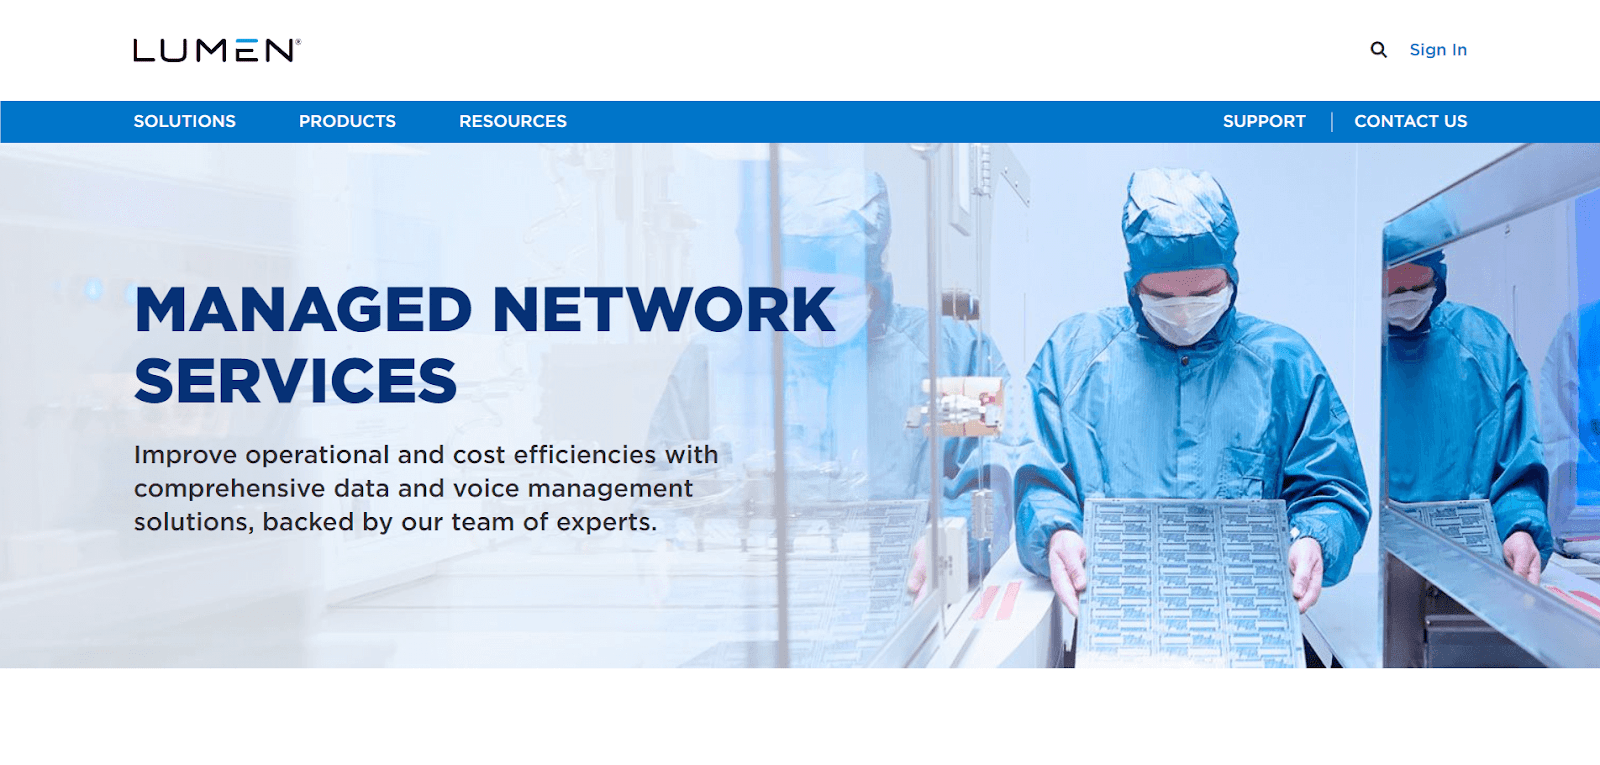
Lumen is a multinational technology company that enables companies to capitalize on emerging applications. The Lumen Managed Network Services product aids in network and application efficiency optimization. It assists you in identifying possible risks and problems and resolving them. The tool integrates network assets, cloud connectivity, security solutions, and voice and collaboration tools into one platform that enables businesses to leverage their data and adopt next-generation technologies.
Key Features:
-
Reduces hardware costs and manpower requirements.
-
Effective use of bandwidth.
-
Examines all potential security breaches.
-
Assists you in expanding your business.
-
Simplified management
Cost:
Users can request quotations from the website.
48. Nastel

Nastel Technologies is a software company that deals in software for IT Operations for AI, DSS, business transactions management, and APM. Nastel Technologies is a leading global provider of mission-critical business transaction performance solutions across the distributed, mainframe, and cloud tiers. It is a privately held corporation based in New York, with offices in the United States, the United Kingdom, Germany, and Mexico, as well as a global network of partners in Europe, the Middle East, Latin America, and Asia.
Key Features:
-
There’s no need to keep an eye on the screen all the time.
-
Enhances and improves user experience.
-
Maintaining application performance with real-time, end-to-end monitoring assists you in lowering operational risk.
-
Supports activities are completed with little resource use.
Cost:
Users can request quotations from the website.
49. Citrix NetScaler

Critics Systems’ key networking product is NetScaler ADC. This APM tool increases the speed and quality of application delivery for end-users. This tool is one of the most comprehensive application delivery platforms and no matter where you are in your cloud journey, they’ve got you covered.
Key Features:
-
A software-only ADC manageability of hybrid/multi-cloud environments.
-
Ensures that the program is always up and running and that it performs flawlessly.
-
App delivery using DevOps intelligence in applications and infrastructure.
-
Improved IT integration.
Cost:
The total one-year cost of Citrix NetScaler MPX-5500 Enterprise Edition comes to $27,360.
50. eG Innovations

eG Innovations provides full-stack application performance monitoring to assist IT professionals in locating, diagnosing, and resolving application issues. IT operations, IT architects, SREs, SMEs, DevOps staff, and developers utilize their products to guarantee that users have the greatest digital experience possible. When performance issues come up, the tool’s root-cause diagnosis engine helps in resolving the problem, thereby ensuring a better consumer experience.
Key Features:
-
Tracing of business transactions and visibility at the application code level
-
Discovery of topologies and display of dependencies.
-
Application and infrastructure support
-
Analytics and reporting for applications.
Cost:
There are different packages provided by the company which includes a free package for easy evaluation, a custom package for a perpetual license, and a package of $300/month.
Things to Consider When Choosing an APM Tool
An organization must invest in contemporary monitoring and application performance monitoring tools. These are created for the ‘new data age’ and driven by the cloud to speed innovation and preserve digital and cloud investments. Here are some fundamental considerations for selecting the appropriate APM tool for your company and optimizing app performance.
-
Assistance with technology- Choose a tool that supports all programming languages or languages that are commonly used in application development, such as JAVA, Python, Node.js, PHP, .NET, and so on. Keep an eye out for mistakes in all languages.
-
Overhead for agents- The agent that you will employ with your application should not cause too much performance overhead. The acceptable limit for transaction response time would be between 10 and 30 milliseconds.
-
Simple to install and maintain- Any program that is also appropriate for APM tools should be simple to deploy, operate and maintain. It must be simple to use, whether with or without installation.
-
Notifications and alerts- Get intelligent alerting since every error has a revenue cost. With smart notifications, you may be notified anytime if any error happens in your applications.
Conclusion
APM is now a practical requirement for teams building and operating modern cloud, hybrid, and distributed systems where small performance regressions can quickly translate into lost revenue and customer trust. The most effective tools in 2026 help you move from alerting to resolution faster by correlating telemetry across the stack and applying intelligent analytics to reduce noise and speed root cause analysis. Industry reporting also points to rising adoption of AI powered monitoring capabilities, reflecting a shift toward more automated detection and response.
When selecting an APM tool, prioritize end to end visibility, strong correlation across services, low operational overhead, and integrations that fit your environment so you can consistently meet SLAs and improve user experience at scale.
FAQs
What is Application Performance Monitoring Tools?
The process of measuring critical software applications' performance parameters using monitoring tools and telemetry data is known as application performance monitoring (APM). APM is used by practitioners to assure system availability, optimize service performance and response times, and enhance user experience. Monitoring is often used for mobile apps, the internet, and commercial applications. Monitoring use cases, however, have expanded to include the services, hosts, networks, processes, logs, and end-users that use these applications- including a company’s customers and workers, in today’s increasingly linked digital world.
Why do businesses need APM?
Mobile apps, websites, and corporate apps may appear simple on the surface but they are quite sophisticated. These programs are made up of millions of lines of code and feature hundreds of interconnected digital services and open-source solutions. They run in containerized environments hosted across numerous cloud providers.
APM tools are used by the digital terms of a company to examine and resolve the numerous variables that might affect an application’s performance. Without these tools, organizations struggle to tackle the myriad problems that might develop, increasing the risk that consumers will become dissatisfied by the bad experience and exit the app entirely.
What are the advantages of APM?
Technical benefits
-
Applications’ stability and uptime have been improved.
-
Less instances of poor performance
-
Performance issues may be resolved more quickly.
-
Software releases that are both faster and of greater quality
-
Increased usage of infrastructure.
Concrete business advantages
-
Developer and operational productivity have both increased.
-
Time spent on innovation has increased.
-
Improved user experiences.
-
Increasing earnings
-
Lowering of operational expenses.
-
Boosting conversion rates.
How does the APM tool work?
-
End-user experience tracking
-
Discovery, modeling, and display of runtime application architecture
-
Transaction profiling with user-defined parameters.
-
Deep-dive monitoring of a component in an application context.
-
Analytics for IT operations.
When should you not utilize APM tools?
When debugging basic applications, avoid using Application Performance Monitoring tools since they take a long time to study application performance and provide the final report.
Is application performance already covered by your network monitoring product or vendor?
If your firm already employs a network monitoring system to assist alleviate network performance issues, it may also have APM features that aren't being used. Alternatively, the company that offers your network monitoring tool may also provide a separate APM solution, which may be bundled with network monitoring. It's not a bad idea to check with your network monitoring provider to see what support they have for application performance and what APM solutions they can supply.