After you ship code and push to production, the hardest problems are often performance problems, not functional bugs. Slow startup times, UI jank, latency spikes, memory leaks, and inefficient CPU usage can raise infrastructure costs, degrade user experience, and hurt discoverability in search where real world performance signals such as Core Web Vitals matter.
In 2026, performance work is also harder because modern apps rely on microservices, containers, and third party dependencies, so bottlenecks can hide in runtime behavior rather than obvious code mistakes. That is why performance profiling tools are essential. Profilers show where time and memory are actually spent, down to functions and call paths, so developers can fix hotspots with minimal code change and validate improvements with evidence. Increasingly, teams use continuous profiling to capture production behavior safely and continuously, supported by newer approaches such as eBPF based profiling and emerging standards work in OpenTelemetry.
1. Orbit Profiler

Orbit Profiler helps companies to visualize the C/C++ application and instantly identify performance issues. To assist developers in viewing and comprehending the complex app's execution path, this debugging tool doubles as a standalone profiler.
It gives you a clear view of everything that is going on within the application so you can swiftly remove any performance bottlenecks and bring your application back to peak performance.
Key Features:
-
As long as an application has access to the pdb file, Orbit runs on any C/C++ application right out of the box. As soon as Orbit has finished downloading, start profiling.
-
Orbit enters the target process using injection and hooks into particular functionalities. Even your highly optimized shipping builds can use it.
-
When you don't know where to start looking, sampling is fantastic. Sampling from Orbit is quick, reliable, and "always on."
Cost:
Contact the company for the details.
2. Performance Pro

Performance Pro is created with the single intention of offering a tool to assist the performance management culture. It supports a streamlined, individualized performance program and is completely automated.
With automatic email reminders, goal progress updates, and the capability for peer-to-peer feedback, Performance Pro encourages continual coaching and feedback. Performance Pro has several customizable options that is in line with company culture, and the frequency of appraisals.
Key Features:
-
Improves staff development through continuously updated progress assessments and automated competency-based training assignments.
-
Allows you to use monetary prizes to better engage and drive your team to reach goals.
-
Supports and closes the gap between annual evaluations by giving prompt, valuable feedback and acknowledgment
-
Enables the automation of existing or newly created performance management programs.
-
Allows managers to constantly monitor and immediately link workplace performance goals to corporate strategies.
Cost:
Contact the company for the details.
3. Performance Cloud

Performance Cloud powered by VMware is an Infrastructure-as-a-Service platform that offers the greatest price-to-performance on the market, complete cost control over your cloud server expenses, and simple VM management. Their servers manage the largest workloads in a secure infrastructure that upholds the highest standards in the sector with lightning-fast speed and cost-effective provisioning.
You can utilize some of the quickest RAM, chipsets, and enterprise-grade CPUs from INTEL, all of which are refreshed frequently to maintain this tool's industry-leading performance. The Pure Storage NVMe Flash Array's premium storage ensures that your application never runs out of IOPS. Even on the smallest VM, it offers the best performance.
Key Features:
-
Make use of the well-known virtualization solutions from VMware to foster corporate innovation.
-
Utilize VMware Cloud Director, an intuitive cloud management software that gives you total access and control over your environment, to manage virtual machines, cloud servers, and operations.
-
Access your cloud resources, including computing, storage, and network, effectively.
-
Your VMs are automatically backed up with integrated protection and disaster recovery management, giving you peace of mind.
Cost:
Contact the company for the details.
4. CheckPOS

For field troops, CheckPOS Performance is a cloud-based platform that enables customers to maintain complete team involvement, metric analysis, and real-time organization. Additionally, it seeks to enhance the strategic execution at the point of sale (POS) for a variety of industries, including marketing, pharmaceuticals, consumer goods, electronics, and more.
Users of CheckPOS Performance can create personalized dashboards that can be shared with coworkers and distributors and are manageable per user and customer. No matter where a user goes, the CheckPOS apps for Android and iOS make real-time information available 24 hours a day, seven days a week.
Key Features:
-
Users can send messages, competitor activity alerts, price catalogs, and stock changes to any team member via the CheckPOS internal messenger.
-
By simply entering the device IP, it grants access control and enables people with permissions to upload reports from anywhere.
-
CheckPOS Performance assists the user with incident reports because field force employees can submit forms at any time of day to report on any event.
-
Produces a snapshot report of the establishment so that the user can confirm the proper location of the brand and its items. To make selecting easier, tags have also been introduced.
Cost:
Contact the company for the details.
5. Pixis Performance

In order to assist brands improve their marketing effectiveness, Pixis Performance is an AI-led platform that integrates sophisticated and contextual AI algorithms. With the aid of this technology, marketers can easily find, customize, and optimize their campaigns.
Pixis Performance operates continuously without requiring human input. It automatically enhances marketing effectiveness based on data-driven insights and promotes brand expansion.
Key Features:
-
Adaptive Cross-Platform Design
-
Automatic Audience Growth
-
Channel Crossing Reporting
-
Goal-Directed Optimization
-
Report at the cohort level.
Cost:
Contact the company for the details.
6. Cornerstone

It can be difficult to make sure that your workforce supports your most crucial KPIs. The correct performance management software, however, makes it simpler to define success for your business and include employees in its goals. You can use the tools provided by Cornerstone Performance to align your people and company strategy. You can swiftly discover and mobilize employees for your organization's top priorities with the help of rich insights into your talent landscape.
Cornerstone gives you a thorough perspective of your employees' superpowers so you can continually raise output, productivity, and engagement levels. You may evaluate and improve personnel competencies with the use of development plans, an extensive skills library, and simple data visualizations.
Key Features:
-
Obtain a precise assessment of your workforce so that you can develop the necessary skills and expand both your business and your personnel more successfully.
-
Provide context-specific feedback to help managers improve as leaders and to help employees become high performers in order to facilitate career and leadership development.
-
Get a flexible performance management solution that can be configured to meet your organizational goals.
Cost:
Contact the company for the detail.
7. Pyroscope
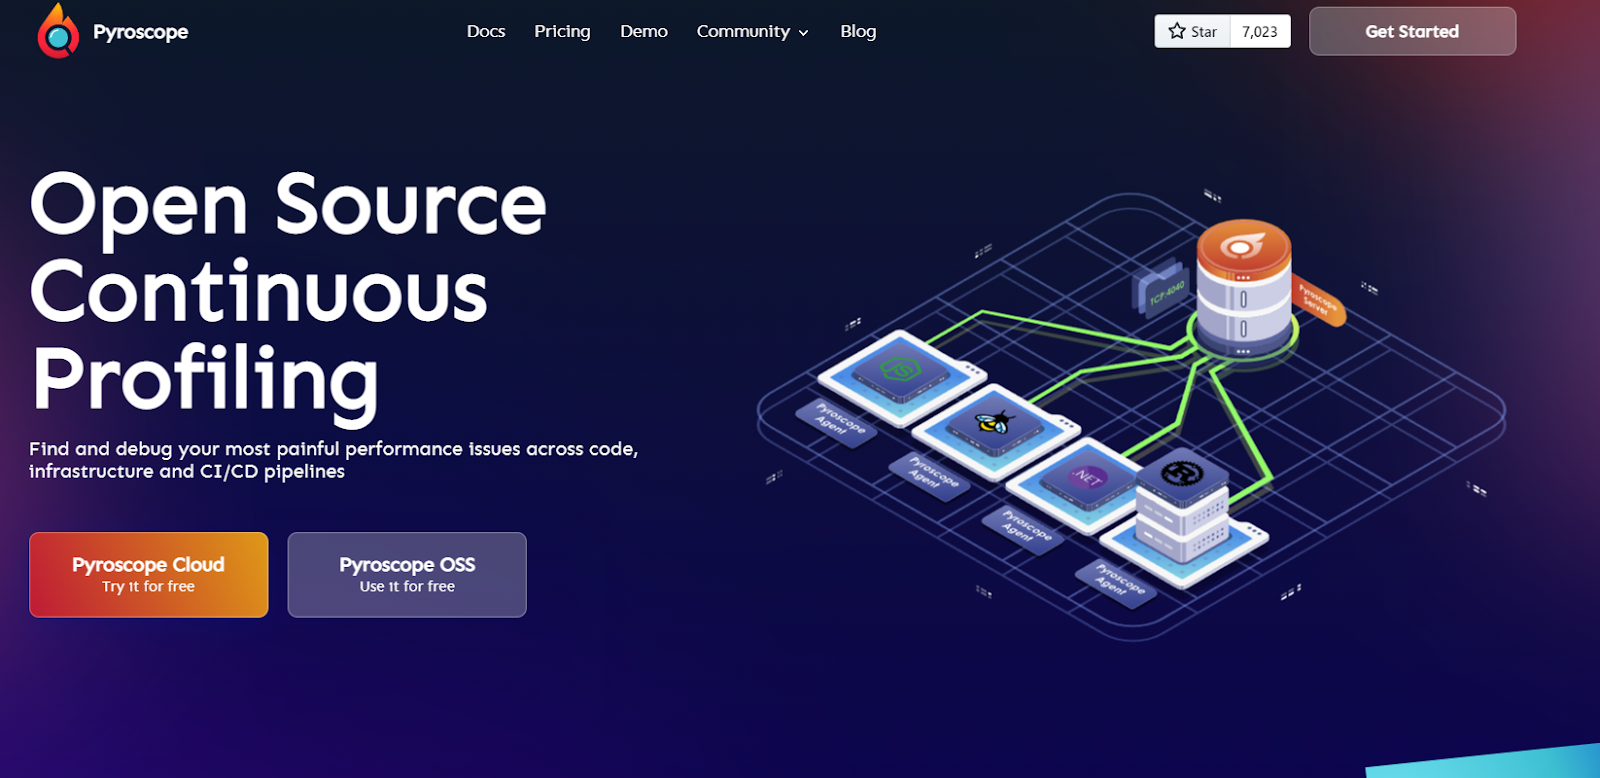
Pyroscope's continuous profiling software is open-source and can assist you in quickly troubleshooting any of your application's performance concerns. No matter what you use, Docker, Linux, or are seeking for Ruby or Go documents, Pyroscope covers you. You may start the server then the agent.
Key Features:
-
Their specialized storage engine produces quick searches, regardless of whether you aim for ten seconds or ten months of software profiling data.
-
As they use sampling profiling technology, which has no impact on performance, you don't need to be concerned about overhead or application performance.
-
Pyroscope efficiently archives your profiling data, making it economical for you to do so even if you want to keep varied profile data from numerous applications for years.
Cost:
Contact the company for the detail.
8. Bubbleprof

Bubbleprof by Clinic.js offers a novel and distinctive method of profiling your Node.js-written program. It makes use of a "bubble" UI that makes it easy for both professionals and novices to calculate the amount of asynchronous time spent in your app. It observes your Node.js processes' asynchronous operations, groups them, figures out their latency, and maps them to show how they work.
Key Features:
-
By examining the size of bubbles within a certain group of activities—which may be your code, a node core, or a module—Bubbleprof determines the durations of those processes. To reduce clutter, it also clubs the nearby groups.
-
Bubbleprof measures the length of the arrows connecting the bubbles in order to compute the delays as the operation moves from one group to the next.
-
Additionally, it makes use of various colors when taking measurements. The delay is simultaneously represented by a variety of async operation types on the inner colored lines.
Cost:
Contact the company for the detail.
9. Uber jvm Profiler
Uber JVM Profiler, which has powerful profiling capabilities, is an additional excellent choice for Java-based applications. It provides a Java Agent that gathers various stack traces and metrics for the distributed Spark/Hadoop JVM processes, such as memory/CPU/IO metrics.
Without altering them, the program may track Java parameters and methods on user codes. It may also be used to track the HDFS name nodes' call latency for each Spark program and identify problems. It can even follow the HDFS file paths used by the Spark app to identify hot files and carry out additional optimization.
Key Features:
-
CPU utilization and garbage collection time troubleshooting
-
Java class method debugging with duration profiling or frequency and time analysis
-
Stacktrack profiling and producing CPU time flamegraphs.
-
I/O metric troubleshooting and JVM thread metrics
Cost:
Contact the company for the detail.
10. Pyinstrument

You can simply use Pyinstrument from the command line instead of creating a Python script to use it. The tool would produce a colored overview of the places where the application spent its time, and your script would execute properly. Additionally, a Python API is included to make the procedure even simpler.
Key Features:
-
Flask and Django both have the possibility to profile web requests, and they also keep extensive documentation.
-
Since statistical profilers have less overhead than tracing profilers, it is advantageous. It becomes simple to trace expensive function calls because the entire stack is recorded.
-
Additionally, Pyinstrument hides library frames so you can concentrate on the programs or modules that are harming performance.
Cost:
Contact the company for the details.
11. Xdebug
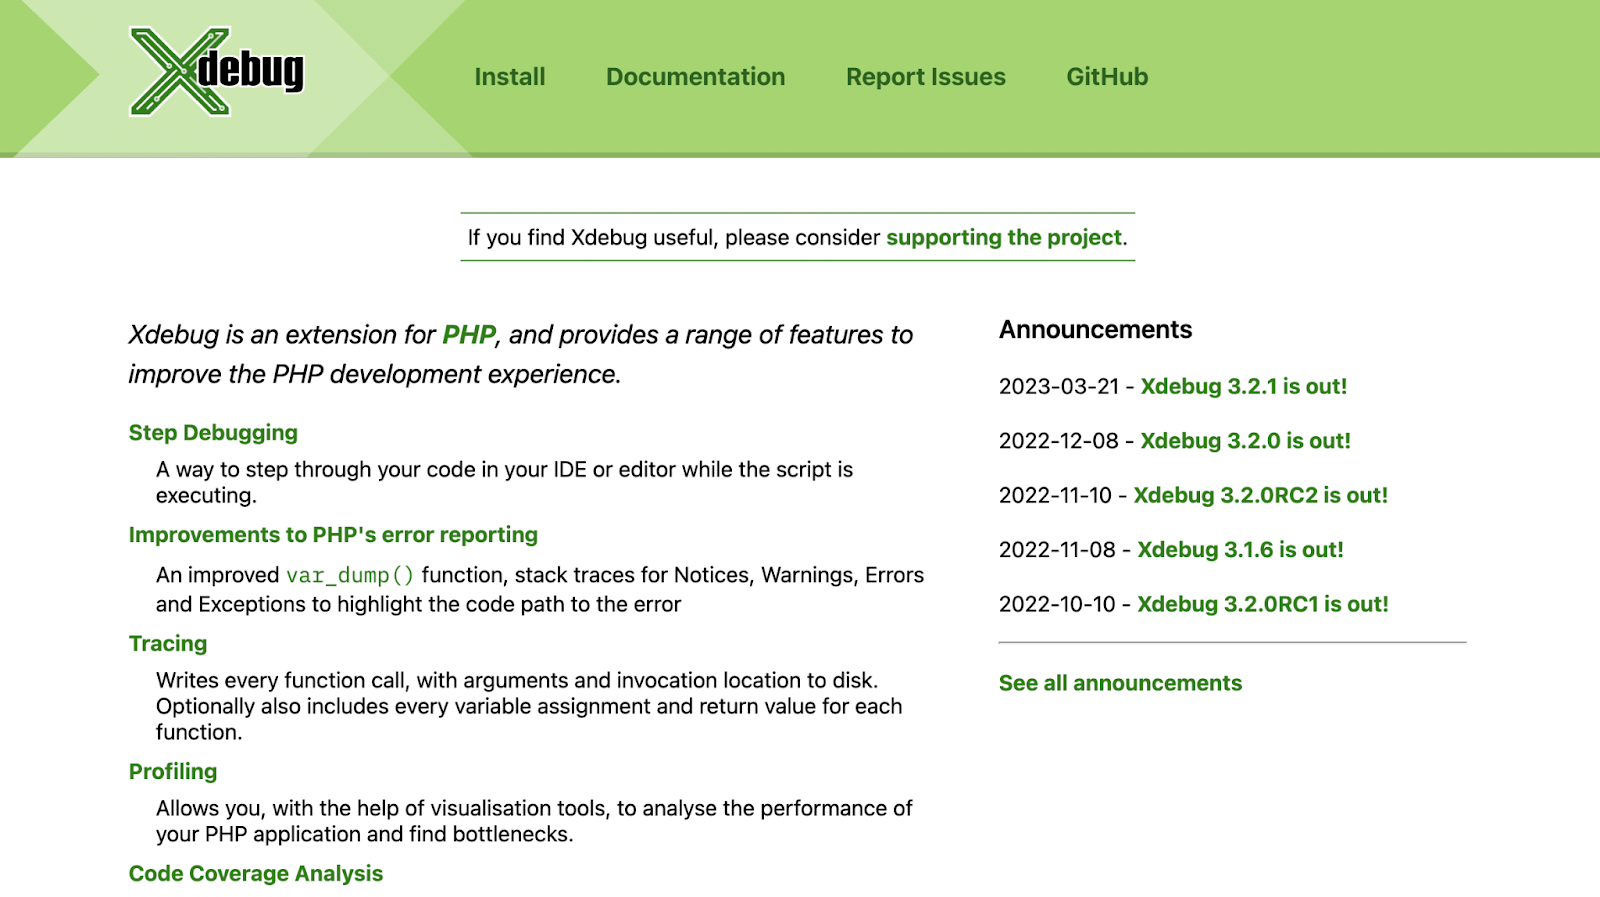
Xdebug offers a comprehensive range of profiling and debugging capabilities to help you fix performance issues with your code and have a little more fun while developing.
It is essentially a PHP plugin that enables you to identify performance bottlenecks in your PHP application and examine its efficiency by generating performance graphs using third-party visualization tools.
Key Features:
-
Xdebug generates a thorough output displaying the application's steps leading up to an error, together with the arguments it supplied to a specific function.
-
To keep track of errors, this is done. It generates colored data and organized views to aid in a developer's understanding of the situation.
-
It also has a remote debugger that you may use to link Xdebug to a running program, integrated development environment, or web browser to view code breakpoints and run programs line by line.
-
It also assists you with unit tests and has a feature called code coverage that displays how frequently your program's code was performed.
Cost:
Contact the company for the details.
12. Prefix

Many developers adore Prefix by Stackify, a lightweight and simple-to-install code profiler. It enables you to optimize the performance of your application and enhance user experience by removing performance bottlenecks.
With Prefix's improved tracing and profiling features, you can easily locate slow SQL queries, hidden exceptions, and more. It gives your developers access to APM's true capabilities. Prefix does this by validating the performance of the code as it is written and allowing you to submit higher-performing programs for testing.
Key Features:
-
Find all the poorly performing, unidentified, and ORM-generated queries.
-
Additionally, you may inspect the impacted data, get the timings, and track each SQL query parameter.
-
Prefix also facilitates the detection of N+1 patterns. Bring all those disorganized logs together instead of going through them to find issues quickly.
-
With Prefix, you may quickly go from one log to a trace for debugging and discover the context of a suspicious log within a query request.
-
Prefix highlights underperforming dependencies, which is helpful for identifying hidden exceptions and navigating framework or older code.
Cost:
Prefix package starts at $0.053 Per Host-Hour.
13. VisualVM

VisualVM, an all-in-one Java troubleshooting solution, is made to be utilized throughout both the development and production phases. It is a visual program that incorporates simple profiling features with JDK command-line tools.
JMX, jvmstat, Attach API, and Serviceability Agent are just a few of the technologies that VisualVM uses to monitor and troubleshoot Java 1.4+ projects.
Key Features:
-
VisualVM keeps track of an application's loaded classes, running threads, heap, metaspace, and permanent generation memory utilization.
-
With aggregated Sleeping, Running, Park, Monitor, and Wait timings, it shows all of the active threads in a timeline.
-
For memory management and application performance, VisualVM supports both instrumentation and sample profilers.
-
In order to give immediate insights into operations, it displays thread dumps.
-
A Java-based process that has crashed can have its environment and some of its fundamental data accessed by VisualVM.
-
Your app's runtime environment and configuration can be saved, and memory dumps, thread dumps, and profiler snapshots can be taken for offline processing at a later time.
Cost:
Contact the company for the details.
14. Tracy

Tracy is a helpful tool that makes it simple for developers to debug PHP programs. It offers a user-friendly design and sophisticated capabilities like CLI support, AJAX call debugging, and others.
Key Features:
-
It can quickly identify and fix mistakes, dump variables, log errors, visualize memory usage, and estimate query or script execution times.
-
You may more readily comprehend and visualize exceptions and faults by using color coding and emphasizing problems in red with concise explanations.
-
Both logging and environment autodetection are included with Tracy.
-
When the server is down, it logs data and shows visitors server error messages.
-
Also compatible with Drupal 7, OpenCart, WordPress, and more platforms, Tracy.
Cost:
Contact the company for the details.
Things to consider while choosing a performance profiling tool
-
Platform support: You need to ensure that the tool you choose supports the platform you are developing for, whether it be Windows, macOS, Linux, or mobile.
-
Language support: Make sure the tool you choose supports the programming language you are using. Some tools are language-specific, while others support multiple languages.
-
Type of profiling: There are different types of profiling, including CPU profiling, memory profiling, and resource profiling. Make sure the tool you choose provides the type of profiling you need for your application.
-
Integration: Consider how well the tool integrates with your development environment, including your code editor and other tools you use.
-
User interface: The user interface of the tool can make a big difference in how well you are able to use it. A well-designed interface can make it easier to use the tool effectively, while a poorly designed interface can make it difficult to use.
-
Cost: The cost of performance profiling tools can vary greatly, so it is important to consider your budget when choosing a tool. Some tools are free, while others can be quite expensive.
-
Documentation and support: Good documentation and support can be essential when you are learning how to use a new tool. Make sure the tool you choose has adequate documentation and support available.
-
Community: A strong community of users and developers can be very helpful when you are using a performance profiling tool. Consider the size and activity level of the community when choosing a tool.
FAQs
What is a performance profiling tool?
A performance profiling tool is a software application that helps software developers identify and optimize the performance of their code. It provides detailed information about the performance of the code, including how much time is spent in each function, how much memory is being used, and where bottlenecks in the code exist.
What advantages come with Performance Profiling enabled?
The following is a list of the advantages of performance profiling:
-
Code bottlenecks can be found using performance profiling.
-
While bottlenecks are detected, changes to the code that are causing a bottleneck to the code are simply made.
Why do I need a performance profiling tool?
A performance profiling tool can help you identify areas of your code that are slow or using too much memory. This information can help you optimize the performance of your code, making it run faster and use less memory. This can improve the user experience and make your applications more scalable.
What types of profiling does a performance profiling tool support?
The types of profiling supported by a performance profiling tool can vary, but the most common types are CPU profiling, memory profiling, and resource profiling. CPU profiling measures the time spent in each function and identifies bottlenecks in the code, while memory profiling measures the memory usage of the code and identifies memory leaks. Resource profiling measures the usage of other resources, such as network and disk I/O.
Is a performance profiling tool platform-specific or can it support multiple platforms?
Performance profiling tools can either be platform-specific or support multiple platforms, depending on the tool. Some tools only support specific platforms, such as Windows or macOS, while others support multiple platforms, such as Windows, macOS, and Linux. It is important to choose a tool that supports the platform you are developing for.