Most teams discover observability gaps during a customer‑impacting incident, not from their dashboards. Working across different tech companies, I have seen the same fire drills repeat on Google Cloud, for example, p95 latency spikes on Cloud Run with no spans, GKE pods OOM‑killed with missing node context, and Cloud Logging ingest blowing past budget. The stakes are high. More than half of organizations said their most recent serious outage cost over $100,000, according to the latest Uptime Institute analysis. That makes picking the right toolset a financial decision as much as a technical one.
Gartner reports the IT operations health and performance analysis software market, which includes APM and observability, reached $19.2 billion in 2023, up 11.6% year over year. I analyzed 15 platforms for Google Cloud teams, then narrowed to five that consistently delivered on depth of telemetry, cost control, and GCP integration. In minutes, you will learn where each tool fits, what it costs, and how to avoid the most expensive mistakes.
5 Best Google Cloud Observability Tools in 2026
Modern Google Cloud environments generate massive volumes of metrics, logs, and traces - but visibility gaps often only surface during outages. The best observability tools in 2026 go beyond dashboards, helping teams understand why systems fail, not just that they failed. This list highlights five platforms that consistently deliver deep GCP integration, scalable telemetry, and cost-aware observability for production workloads.
1. groundcover
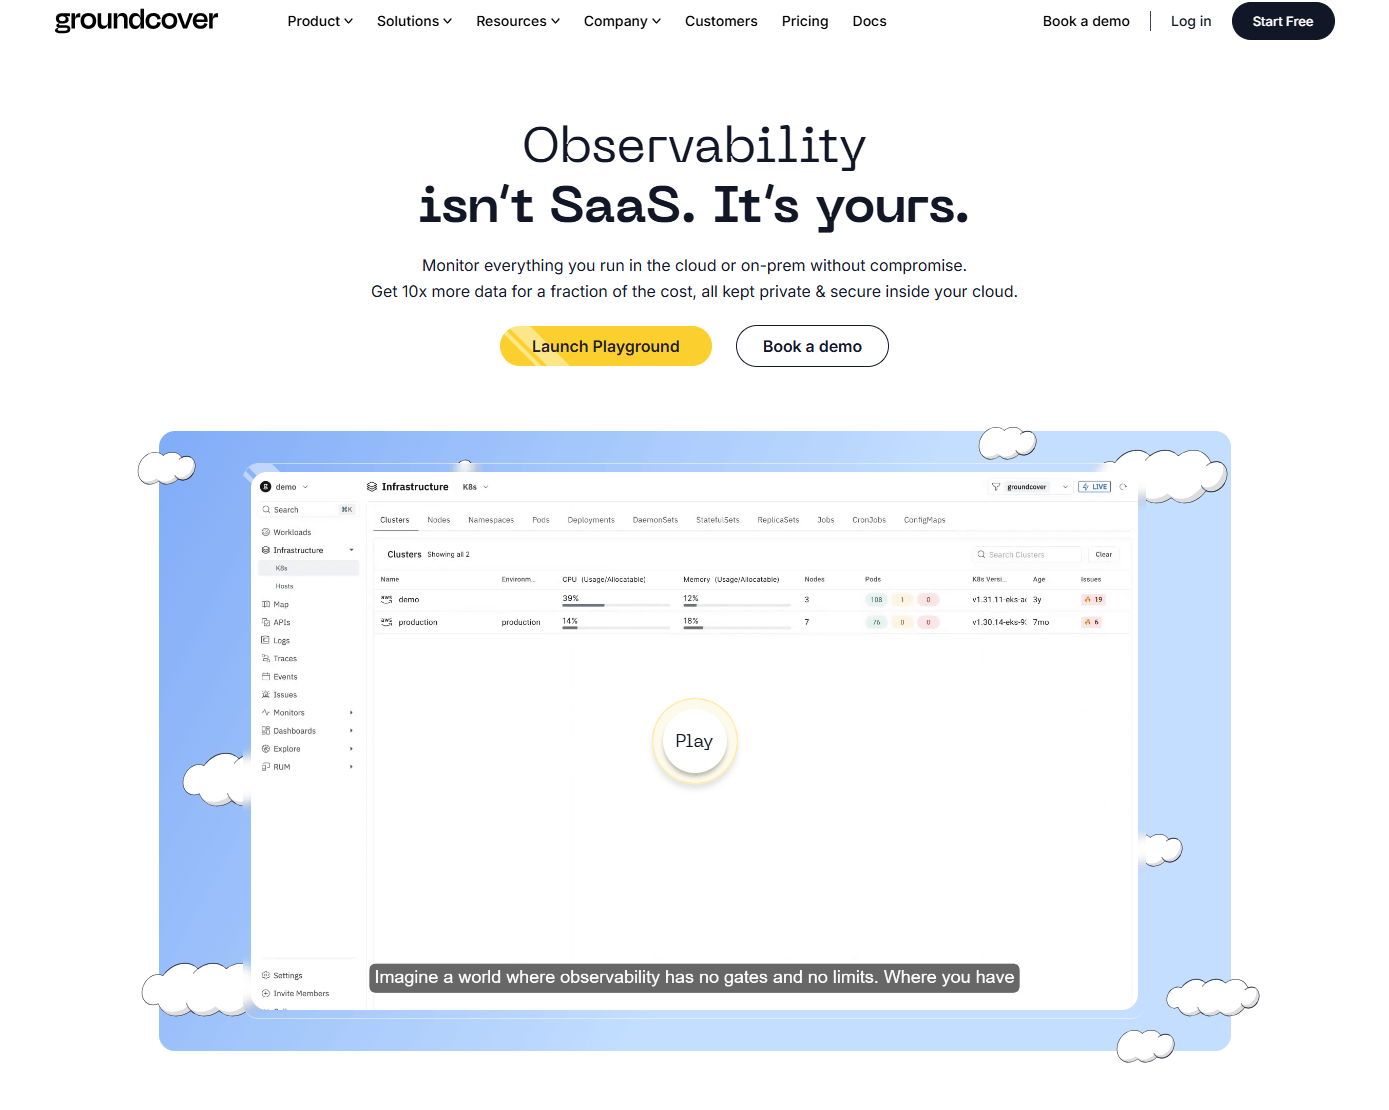
groundcover is an eBPF‑powered, Kubernetes‑first observability platform that emphasizes low overhead and deep network and application visibility. It offers a bring‑your‑own‑cloud deployment model so data stays in your environment while the control plane is managed.
Best for: GKE‑heavy teams that want deep kernel‑level and service insights with predictable data residency and cost control.
Key features:
- eBPF‑based auto‑instrumentation for traces and metrics across services and infrastructure.
- BYOC architecture that keeps telemetry in your cloud or on‑prem environment.
- Kubernetes‑native dashboards and alerting with Helm and GitOps friendly workflows.
Why we like it: In GKE, eBPF gives you wire‑level context without code changes, which shortens time to usable traces and avoids agent sprawl.
Notable limitations:
- Documentation depth and maturity are still evolving based on user reviews.
- Some reviewers note that, like any deep kernel-level observability approach, cluster sizing and tuning are important to balance visibility and resource usage.
Pricing: Pricing not publicly available. Contact groundcover for a custom quote. The company highlights a BYOC model in recent funding announcements, which signals a focus on predictable costs.
2. Dynatrace
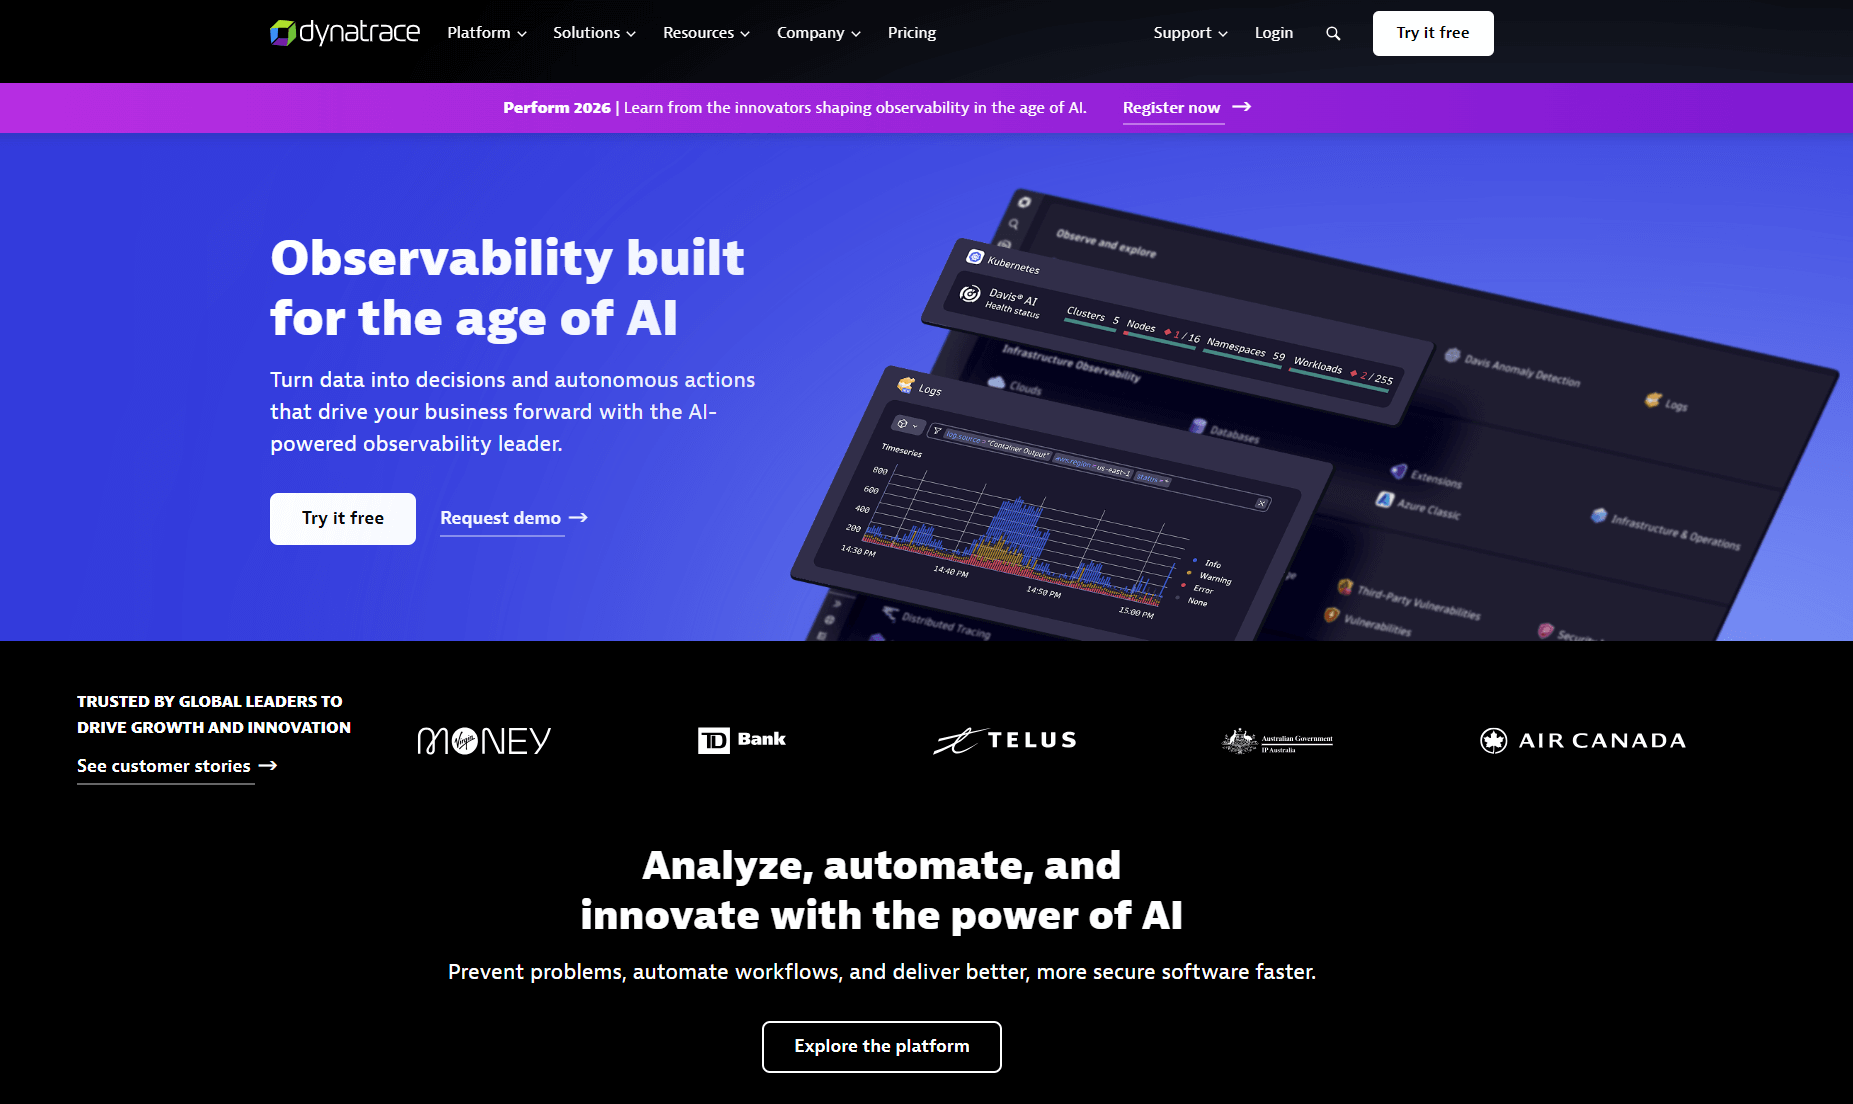
A unified observability, security, and analytics platform that correlates topology, logs, metrics, traces, and events with its Davis AI for root cause and automation. Widely adopted in regulated and large enterprises.
Best for: Enterprises running mixed GKE, Compute Engine, and hybrid workloads that want AI‑assisted troubleshooting, topology mapping, and governed analytics.
Key features:
- Davis AI for causal analysis and problem remediation across stacks.
- Smartscape topology mapping to visualize dependencies.
- Grail data lakehouse unifying logs, metrics, and traces with query and governance.
- OpenTelemetry ingestion and Kubernetes‑native monitoring.
Why we like it: On complex GCP estates, Grail plus Smartscape shortens triage from "where is the fault" to "what to fix" while preserving data context for audits.
Notable limitations:
- Steep learning curve and admin complexity for new teams.
- Pricing can be perceived as high without careful scoping and governance.
Pricing: Pricing is contract-based, with public reference ranges available via third-party marketplaces and review sites. Actual costs vary significantly based on host size, data volume, and enabled modules. Marketplace offers and private terms are also available on AWS Marketplace.
3. Datadog
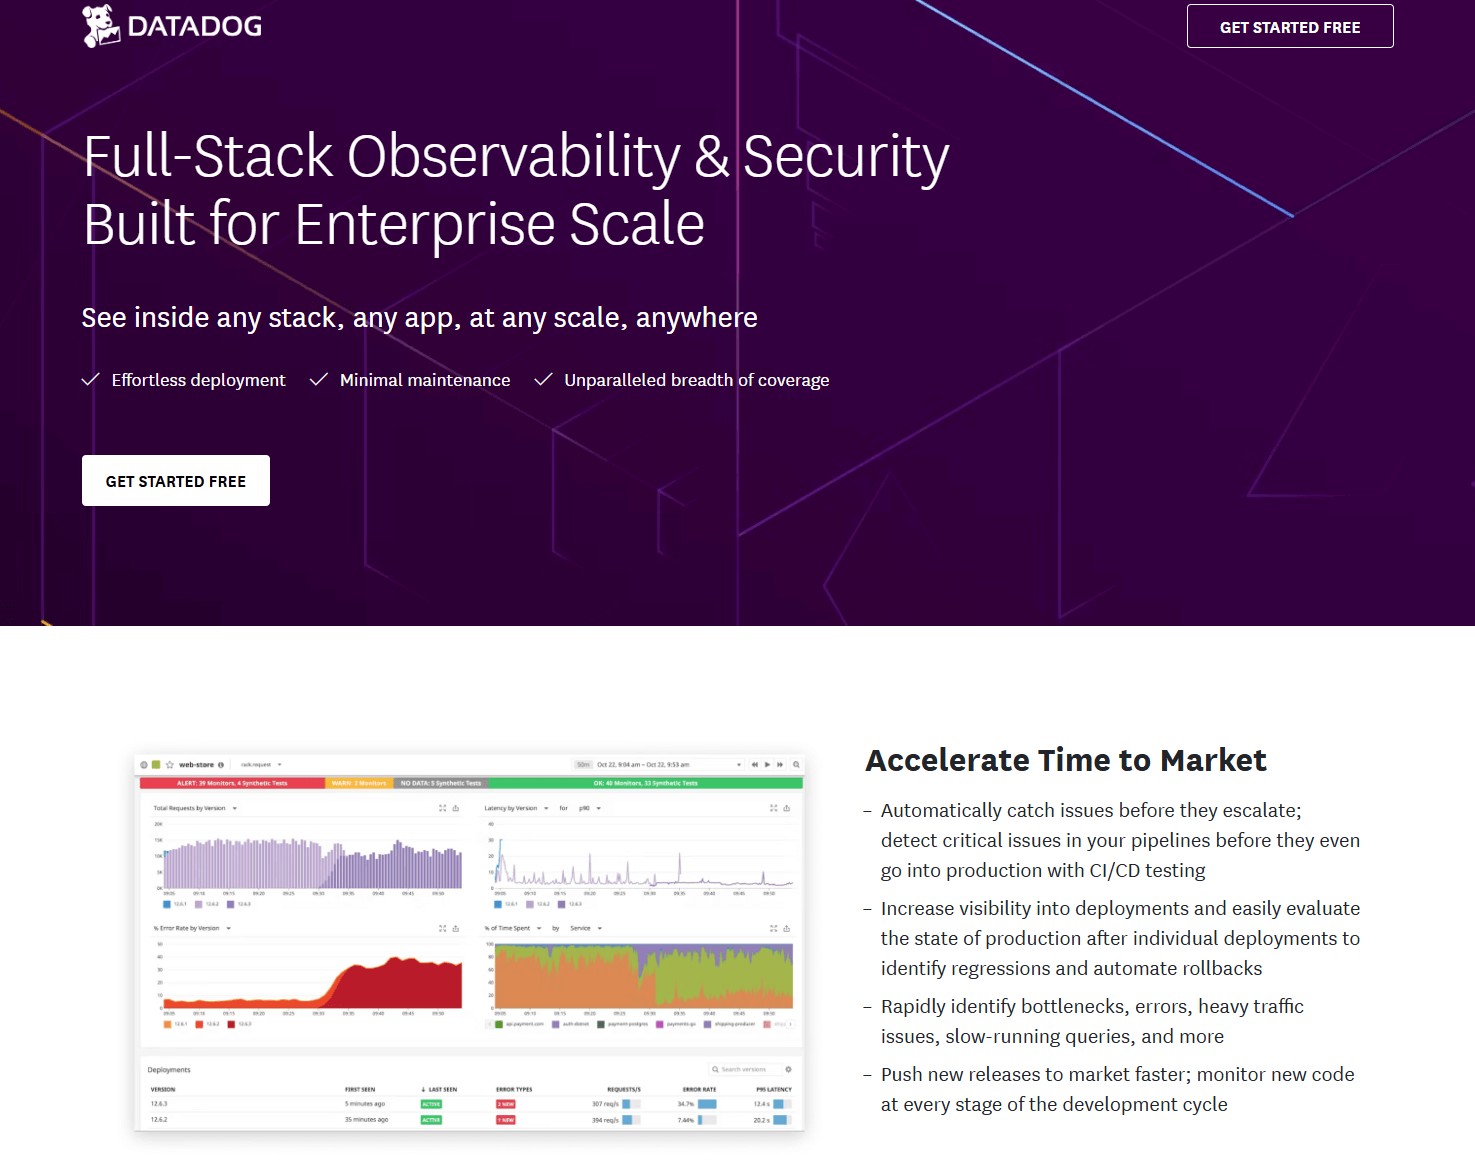
A SaaS observability and security platform covering infrastructure, APM, logs, RUM, synthetics, and data pipelines. Strong integration catalog is useful for multi‑cloud and hybrid environments.
Best for: Teams that want fast time to value with 850+ integrations and granular, modular products that map to specific GCP services.
Key features:
- Infrastructure, APM, logs, synthetics, and RUM in one console.
- Broad integration coverage for GCP services and common runtimes.
- AI features for anomaly detection and, more recently, agent and LLM monitoring.
Why we like it: For Google Cloud quick starts, the integrations and default dashboards reduce setup time and make it easy to centralize telemetry.
Notable limitations:
- Costs can rise quickly at scale, especially with logs and custom metrics.
- Initial setup can feel overwhelming due to the breadth of features.
Pricing: Transparent pricing is published via AWS Marketplace, for example, Datadog Enterprise shows $27 per host for infrastructure and $36 per APM host per month with usage add‑ons like logs and synthetics. Independent reviews discuss cost and complexity tradeoffs.
4. Google Cloud Observability
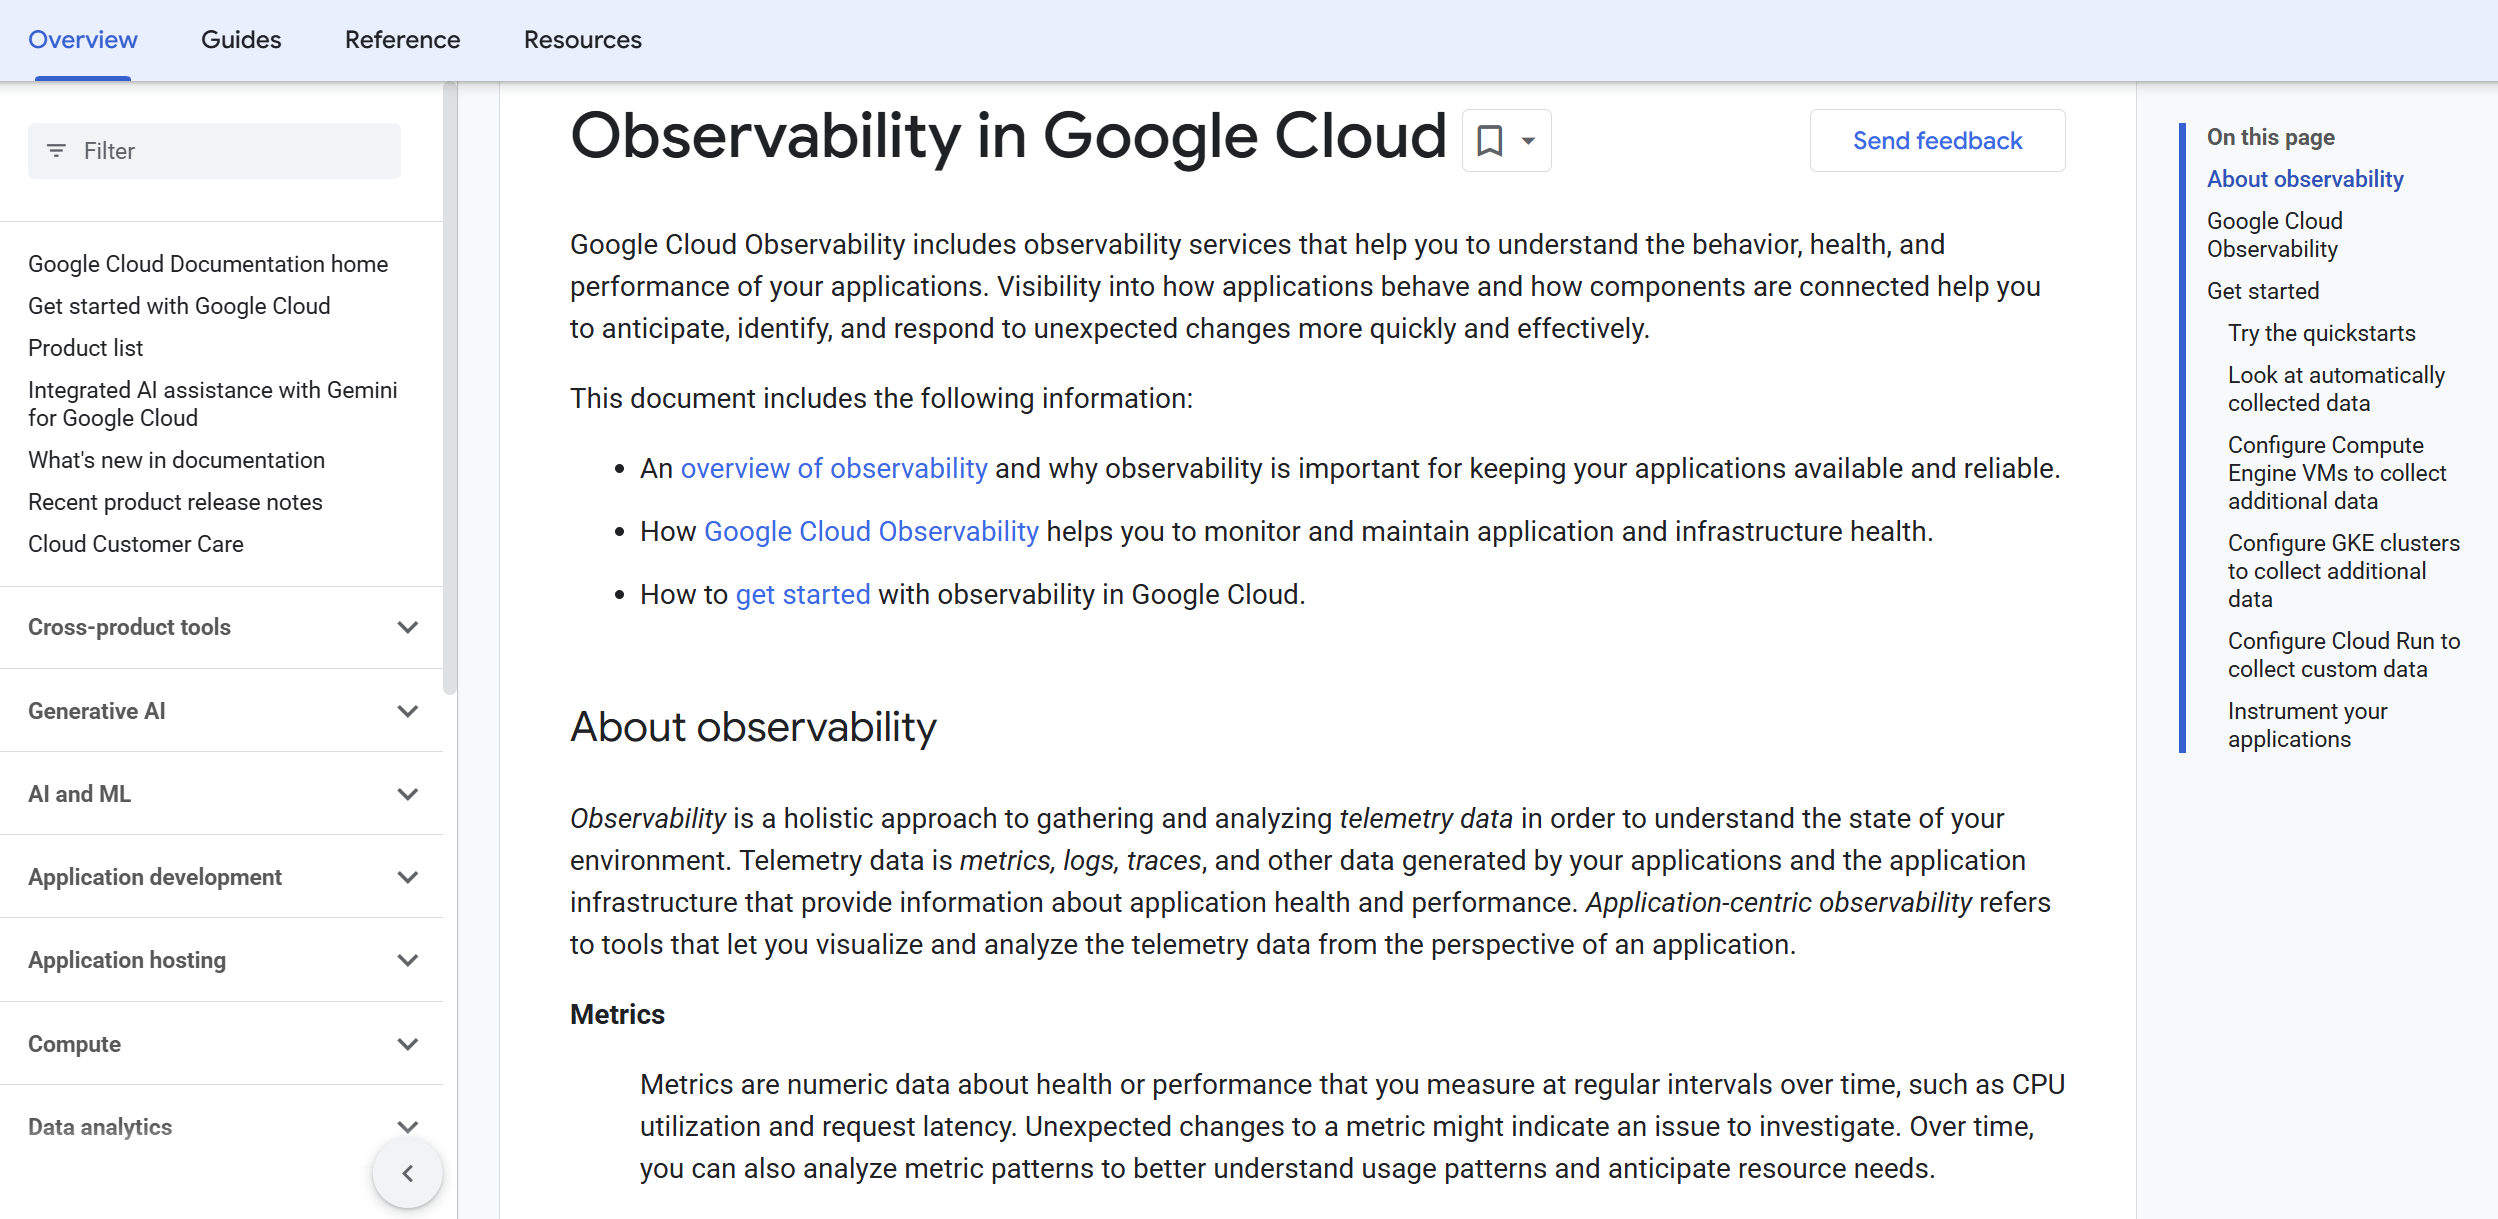
A managed suite for metrics, logs, tracing, error reporting, and profiling across Google Cloud and hybrid estates. It provides default dashboards and service‑aware telemetry for many GCP products.
Best for: Google‑first teams that prefer native, managed telemetry with service‑level defaults and tight integration to GCP IAM and billing.
Key features:
- Cloud Logging, Monitoring, Trace, Error Reporting, and Profiler for managed telemetry.
- Default dashboards for services like GKE, Compute Engine, and Cloud Run.
- Support for OpenTelemetry and Managed Service for Prometheus.
Why we like it: If your workloads are primarily on GCP, the built‑in metrics and service awareness speed up onboarding and cut operational overhead.
Notable limitations:
- Several users report cost predictability challenges with log ingestion and retention.
- Depth of APM features and cross‑stack correlations can lag dedicated third‑party suites, based on peer reviews.
Pricing: Usage‑based with free allotments per service, for example, logging free tiers and per‑GiB ingestion beyond that. Independent summaries are available from third‑party sources, but rates vary by product and region and can change, so verify against the official pricing page.
5. OpenLIT
An open‑source, OpenTelemetry‑native platform focused on LLM and GenAI application observability. It adds cost tracking, guardrails, evaluations, and GPU metrics for AI workloads.
Best for: Teams building LLM apps on GCP that want vendor‑neutral, self‑hosted observability integrated with OTel and their existing backends.
Key features:
- OpenTelemetry‑native tracing and metrics for LLMs, vector DBs, and GPUs.
- Cost tracking, prompt management, and evaluations for AI workflows.
- Kubernetes operator for zero‑code auto‑instrumentation of AI workloads.
Why we like it: It brings observability discipline to AI systems on GKE and Vertex AI, while keeping data in your control and avoiding lock‑in.
Notable limitations:
- Operability and support depend on your team, since it is self‑hosted.
- Community and ecosystem, while growing, are smaller than commercial suites.
Pricing: Open source and free to self‑host under the Apache‑2.0 license.
Observability Tools Comparison: Quick Overview
No single observability tool fits every Google Cloud team. Some prioritize Kubernetes depth, others focus on AI-driven root cause analysis, while managed GCP-native tools optimize for simplicity. This comparison provides a high-level snapshot to help teams quickly understand where each platform excels and what tradeoffs to expect:
| Tool | Best For | Pricing Model | Free Trial | Highlights |
|---|---|---|---|---|
| groundcover | GKE‑centric teams that want eBPF depth and data residency control | Custom quote, BYOC model | Not advertised | eBPF auto‑instrumentation, Kubernetes‑native views |
| Dynatrace | Enterprise SRE, platform and security teams on GCP and hybrid | Subscription with usage components | Free trial | Davis AI root cause, Smartscape topology, Grail data lakehouse |
| Datadog | Multi‑cloud teams needing fast integrations and modular add‑ons | Modular SaaS, feature add‑ons | Free tier | 850+ integrations, strong dashboards and synthetics |
| Google Cloud Observability | GCP‑first orgs wanting managed defaults and service awareness | Usage based by product | Free allotments | Native metrics, logs, tracing, profiling |
| OpenLIT | LLM and GenAI app teams on GCP wanting OTel‑first, self‑hosted | Open source, self‑hosted | Yes | LLM traces, cost tracking, guardrails, GPU metrics |
Observability Deployment Options
Where and how telemetry data is stored has become a strategic decision, not just an architectural one. Deployment models now range from fully managed SaaS to bring-your-own-cloud (BYOC) and self-hosted setups, each with implications for cost, compliance, and control. This table outlines how leading observability platforms approach deployment across cloud, on-prem, and restricted environments:
| Tool | Cloud API | On-Premise | Air-Gapped | Integration Complexity |
|---|---|---|---|---|
| groundcover | Yes | Yes, BYOC | Possible, depends on customer environment | Medium |
| Dynatrace | Yes | Yes | Supported via Managed deployments | Medium |
| Datadog | Yes | Limited, SaaS‑first | Not typical | Low-Medium |
| Google Cloud Observability | Yes | Limited hybrid via agents | Not typical | Low |
| OpenLIT | Yes | Yes, self‑host | Possible with self‑hosting | Medium |
Observability Strategic Decision Framework
Choosing an observability platform is less about features in isolation and more about long-term operational impact. Teams must balance data residency, outage risk, AI readiness, and vendor lock-in, often under real budget pressure. This framework surfaces the critical questions teams should ask before committing to an observability strategy on Google Cloud:
| Critical Question | Why It Matters | What to Evaluate | Red Flags |
|---|---|---|---|
| Where will telemetry live? | Data residency and cost | BYOC, storage tiers, retention and query costs | Unclear storage and egress terms |
| How do we prevent outage costs? | 54% of major outages cost $100k plus | RCA speed, topology, SLOs, alerting | Tool sprawl, weak correlations |
| Do we need AI or LLM observability? | AI usage is rising on GCP | LLM traces, cost tracking, guardrails | No OTel path, vendor lock‑in |
| What is our exit path? | Avoid lock-in | OTel coverage, export formats, APIs | Closed formats, proprietary agents only |
Observability Solutions Comparison: Pricing & Capabilities Overview
Observability costs can vary dramatically depending on architecture, data volume, and pricing model. From usage-based native tools to enterprise contracts and BYOC platforms, pricing structures directly influence scalability and predictability. This comparison helps teams align observability capabilities with organizational size, growth stage, and budget expectations:
| Organization Size | Recommended Setup | Monthly Cost | Annual Investment |
|---|---|---|---|
| Startup on GKE | Google Cloud Observability defaults plus OpenLIT for LLMs | Varies by usage | Varies by usage |
| Mid‑market multi‑cloud | Datadog core with APM, logs, synthetics on priority services | Refer to AWS Marketplace rates and usage | Depends on host, logs, metrics volume |
| Enterprise hybrid | Dynatrace platform with GKE, Compute Engine, and OTel ingestion | Contract‑based | Contract‑based |
| Cost‑conscious K8s‑first | groundcover BYOC plus native GCP metrics | Custom quote | Custom quote |
Problems & Solutions
Most observability investments are tested during real incidents - unexpected bills, performance degradation, or blind spots in production. The scenarios below reflect common challenges faced by Google Cloud teams and show how different tools approach cost control, Kubernetes debugging, and emerging AI workloads. These practical comparisons highlight where each platform delivers value under pressure.
Problem 1: Surprise Cloud Logging bill after a traffic spike
- Google Cloud Observability: Use exclusion filters, sampling, and routing to external sinks to control ingestion and retention spend. Independent guides summarize these controls and typical pricing patterns, for example, the Economize overview of Cloud Logging pricing and cost levers.
- Datadog: Use pipelines, sampling, and retention tuning, a common recommendation in third‑party reviews that also note costs rise with log volume.
- Dynatrace: Consolidate signals into a single analytics layer to reduce tool sprawl and apply usage policies, which peer reviews say is important due to perceived pricing complexity.
- groundcover: BYOC keeps raw telemetry in your environment to avoid per-ingest surprises, highlighted in recent funding coverage.
- OpenLIT: Self‑hosted OTel‑native stack lets you route LLM traces and metrics into low‑cost backends while preserving visibility.
Problem 2: GKE workload slows down with intermittent p95 spikes and OOM kills
- Dynatrace: Topology mapping, Davis AI, and code‑level tracing help correlate Kubernetes node pressure, pod rescheduling, and service hot paths, which is why it is frequently adopted for enterprise platform teams.
- Datadog: Service maps and APM traces connect pod‑level metrics to request flows; independent testing calls out strong analytics and integrations.
- groundcover: eBPF instrumentation surfaces kernel‑level signals that standard agents miss, useful for GKE debugging, with BYOC reducing ingest anxiety during incidents.
- Google Cloud Observability: Default GKE dashboards and managed Prometheus support shorten setup for cluster and workload metrics, making it a solid baseline before layering third‑party tools. Cost governance remains important, which many users flag in reviews.
Problem 3: Shipping GenAI features on Vertex AI and GKE with no visibility into agent behavior, latency, and token costs
- OpenLIT: Adds OTel‑native LLM traces, cost tracking, and evaluations, and can be run alongside your existing OTel collector and storage.
- Datadog: Analysts called out new AI observability and agent monitoring capabilities surfaced at the 2025 DASH event, reflecting product momentum in AI use cases.
- Strategic backdrop: OpenTelemetry adoption across clouds continues to grow, making vendor‑neutral instrumentation a pragmatic hedge for AI workloads.
What the Best Choice Looks Like
- If you are GCP‑first and cost sensitive, start with Google Cloud Observability, turn on SLOs, and set log exclusion and retention guardrails, then add OpenLIT where you run LLMs.
- If you are an enterprise with strict RCA and audit needs, Dynatrace's AI and data model can reduce time to mitigation across GKE, Compute Engine, and hybrid estates.
- If you value integration breadth and a modular path, Datadog's catalog and marketplace pricing make it easy to start, then add features as needed.
- If Kubernetes is your production backbone and data residency matters, groundcover's eBPF and BYOC design will resonate.
Supporting data: 54% of significant outages cost over $100,000, which makes disciplined observability and cost controls a measurable risk reducer. And the broader observability market continues to grow as part of IT operations analytics software.
Conclusion
Google Cloud observability is no longer just about collecting telemetry - it's about making informed decisions before incidents escalate and costs spiral. The right tool depends on your architecture, scale, and tolerance for operational risk. Whether you prioritize managed simplicity, enterprise AI-driven analysis, or Kubernetes-first visibility with cost control, disciplined observability remains one of the most effective ways to reduce outage impact and cloud waste.