
An OpenTelemetry-native platform starts at OTLP. Spans, metrics, and logs land from a Collector, and the store, the query language, and the dashboards are built around that payload. Accepting OTLP is not the same purchase as shipping an OTel-native store: many agents still own the schema and treat OTLP as an ingest adapter. Shop the Collector path, semantic conventions that survive ingest, query languages you can take with you, and cost controls that assume high-cardinality OTel attributes.
Buying here means the store is OTel-native, not an agent schema with an ingest adapter on the side. An endpoint on a datasheet is not enough. Match the platform to the job, from a greenfield Collector and a Grafana shop to a hyperscale control plane or a wide-event debugger. For adjacent shortlists, see our Elastic Observability alternatives page.
OpenTelemetry-Native Observability at a Glance
| Platform | Best for | Pricing model | Highlights |
|---|---|---|---|
| Dash0 | OTel-native SaaS when you want PromQL and Perses | Per signal, public rates | SignalControl bills storage on what you keep |
| Honeycomb | High-cardinality debugging on wide events | Events, public plans | BubbleUp. Unlimited attributes and users on the event model |
| SigNoz | Open-source OTel-native logs, metrics, and traces on ClickHouse | Usage, public cloud rates | Cloud plus Community self-host |
| Chronosphere | Hyperscale control plane for OTel/Prometheus cardinality and cost | Quote | Control Plane shapes data before you store it |
| Grafana Cloud | Tempo, Loki, and Mimir path with open query languages | Free + usage | Adaptive Telemetry plus OTLP on the open LGT stack |
| Uptrace | OTel-native ClickHouse store with public per-GB rates | Usage, public rates | Cloud plus free Community self-host. No per-user fees |
| New Relic | Full-stack OTLP platform with public OTel docs | Usage, public rates | Documented OTLP endpoint beside agent products |
How we evaluated OpenTelemetry-native observability platforms
We used five checks on vendor product and pricing pages: OTLP fidelity and semantic conventions (whether the store is OTel-native, not an adapter on an agent schema), signal coverage across logs, metrics, and traces, query portability (PromQL, SQL, TraceQL, or a language you cannot take with you), cost controls for cardinality and volume, and whether any price is public or the page is quote-only.
Dash0
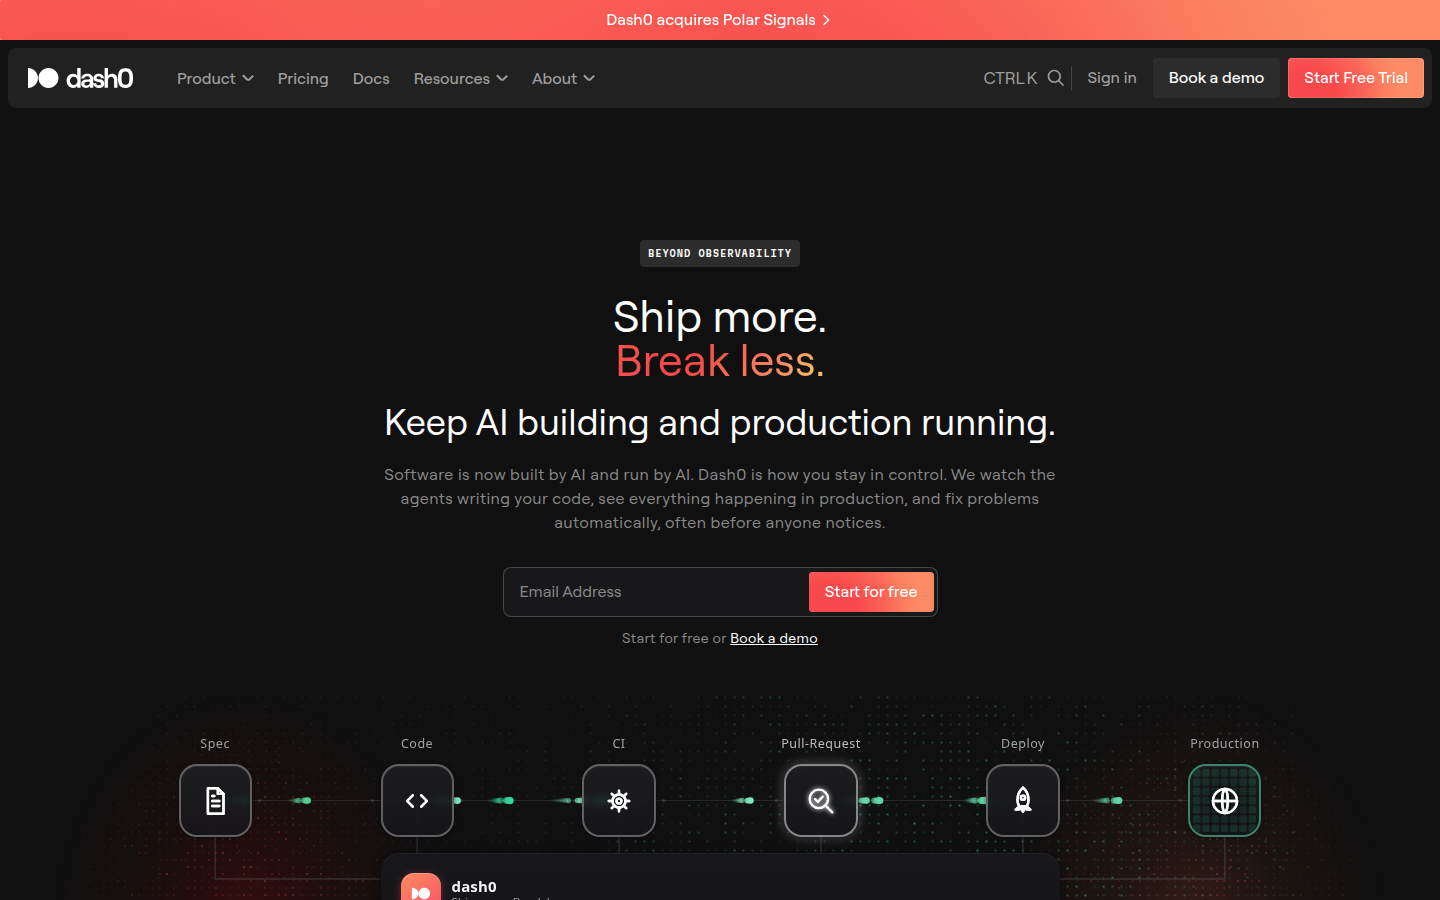
Dash0 is OpenTelemetry-native SaaS. The homepage puts PromQL, SQL, and OpenTelemetry on the same store, SignalStore, and says every OpenTelemetry Collector can talk to Dash0 with a short config. SignalControl sits on that Collector path and bills storage on the telemetry you keep. Dashboards can be managed as code; Dash0 documents Perses as the open dashboard format, including import and export.
Public rates split ingest and storage. A 14-day trial is on the pricing page, no credit card. Agent0 credits are a separate consumption line for the built-in production AI. AI SDLC Insights is a separate per-user line at $10/user/month.
Best for: Teams that want an OTel-native SaaS platform with real PromQL and as-code dashboards.
Key features:
- PromQL, SQL, and OpenTelemetry as query interfaces on an OTLP store
- SignalControl on the Collector you already run. Storage billed on what you keep
- Perses dashboards as code, plus PromQL alert rules you can reuse
Why we like it: High-cardinality attributes are not a surprise GB line. You send OTLP, you query with PromQL, and SignalControl can drop noise before it sits in storage.
Notable limitations:
- Agent0 is a credit line on top of telemetry ($0.60/credit). AI SDLC Insights adds $10/user/month
- Public rates are consumption SaaS. Self-hosted ingest tiers are for very large volumes, not a Community-style cluster you stand up this afternoon
- The product is newer than the Grafana or New Relic consoles. Ask for reference traffic at your cardinality
Pricing: Public per-million rates. Spans, log records, and web events: ingest $0.060 plus storage $0.540 with 30-day retention. Metric data points: ingest $0.020 plus storage $0.180 with 13-month retention. Agent0 credits $0.60 each. AI SDLC Insights $10/user/month. 14-day unlimited trial, no credit card. Marketplace listings on AWS, GCP, Azure, and Vercel.
Honeycomb
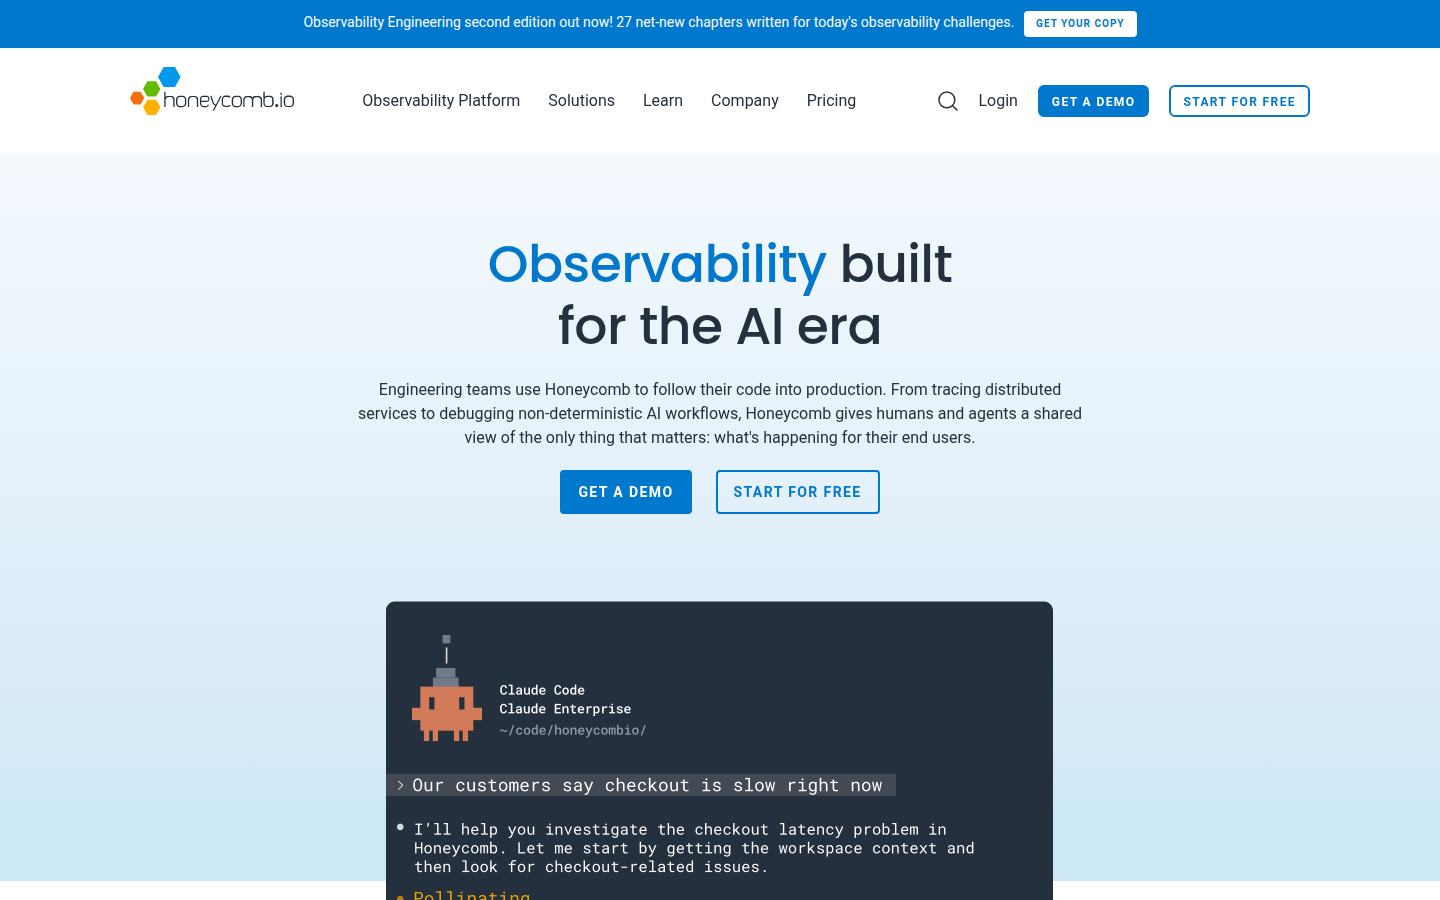
Honeycomb is the wide-event debugger on this list. The homepage is explicit: high-cardinality, event-based data, unlimited custom fields, unlimited users, OpenTelemetry-native ingest. BubbleUp compares a selected cohort against the baseline without pre-aggregating the interesting attributes away. Triggers, SLOs, heatmaps, and tracing sit on that same event model. Metrics data points are a separate volume on the public plans.
You get query speed on high-cardinality production events. The query language is Honeycomb’s. Boards do not paste into PromQL. Pipeline processing is listed as its own product line on the pricing page; do not mix that figure into the event plan.
Best for: Teams debugging with wide events and high-cardinality attributes, and willing to live in Honeycomb’s query model.
Key features:
- Unlimited attributes and unlimited users on the event model
- BubbleUp, heatmaps, tracing, triggers, and SLOs
- Public Free, Pro, and Enterprise event volumes, plus a separate metrics volume
Why we like it: You can attach the field you actually need on a trace and still query it. BubbleUp runs on that width instead of asking you to pre-choose dimensions.
Notable limitations:
- Query language is proprietary. PromQL boards will not paste in
- Logs as a separate warehouse are not the headline. The unit is the wide event
- Enterprise is quote after the public Pro cap. Pipeline processing is a different line
Pricing: Free: up to 20 million events and 100 million metric data points per month. Pro: from $150 for 50M events, scaling up to 750M events and 3.75 billion metric data points. From July 1, 2026, new Pro plans are $3.00 per million events (legacy Pro was $1.30/M). Enterprise: custom, with a published base allowance of 10 billion events per year. Unlimited users on the published plans.
SigNoz
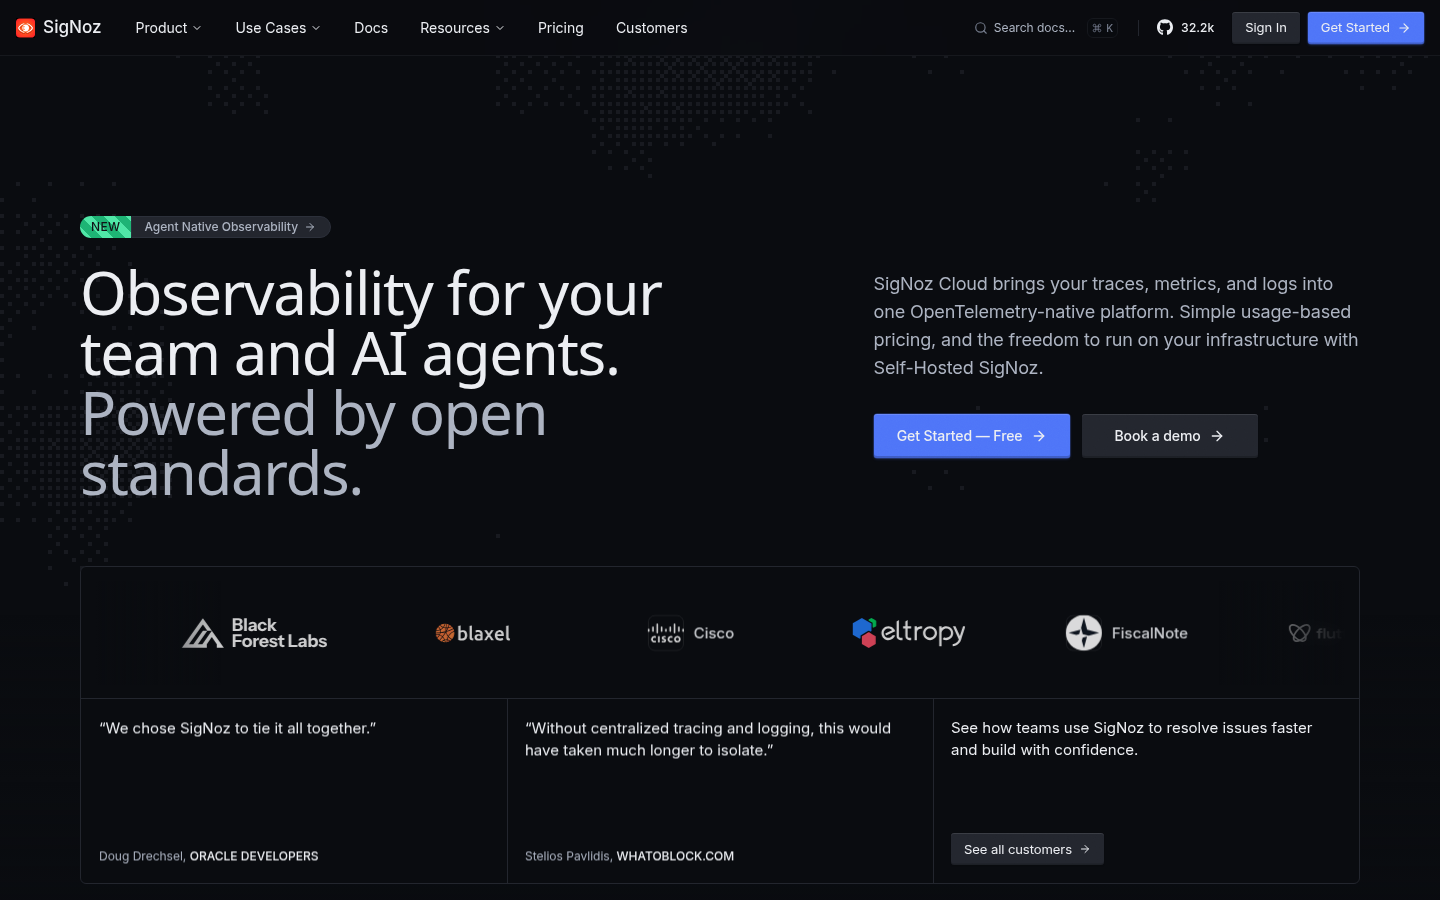
SigNoz is the open-source OpenTelemetry-native platform on ClickHouse. Cloud takes traces, metrics, and logs in one product. Self-Hosted SigNoz (Community) is the cluster you operate. Query builder, PromQL, and ClickHouse SQL are all on the page. There is no per-host price and no per-user price on Cloud. Teams starts from a monthly minimum that includes that much usage, then usage above it.
The same ClickHouse path can run in SigNoz Cloud or in a cluster you operate. Enterprise comes in three offerings: Enterprise Cloud (starts at $4,000/month and includes ingestion usage up to $4,000), Enterprise Self-Hosted (a separate support contract for the cluster you run), and Bring Your Own Cloud (SigNoz runs it in your cloud). Name which offering you are quoting. Community is free software without that support contract.
Best for: Teams that want an OTel-native logs, metrics, and traces store on ClickHouse, in cloud or in their own cluster.
Key features:
- Correlated logs, traces, and metrics on an OTLP path
- Query builder, PromQL, and ClickHouse SQL on a columnar store
- SigNoz Cloud (Teams and Enterprise) plus Community self-host
Why we like it: The same OpenTelemetry payload can land in Cloud today and in a cluster you operate later. PromQL and ClickHouse SQL stay on that store instead of a one-vendor language.
Notable limitations:
- Self-host is a staffing decision. Community does not include Cloud support and compliance
- Cloud retention on the public rates is 15 days for logs and traces, one month for metrics. Longer retention is a different conversation
- Enterprise Cloud’s $4,000 floor is not the price for Self-Hosted support or BYOC. Those are separate contracts
Pricing: Teams from $49 per month, including $49 of usage. After that, logs and traces $0.30/GB ingested (15-day retention), metrics $0.10 per million samples (one-month retention). Enterprise Cloud from $4,000 per month, including ingestion usage up to $4,000. Enterprise Self-Hosted and BYOC are separate support/ops contracts. Community self-host is free software you operate. A startup discount ($19 per month for 12 months, with eligibility caps) is promotional. Verify it on the pricing page the day you buy.
Chronosphere
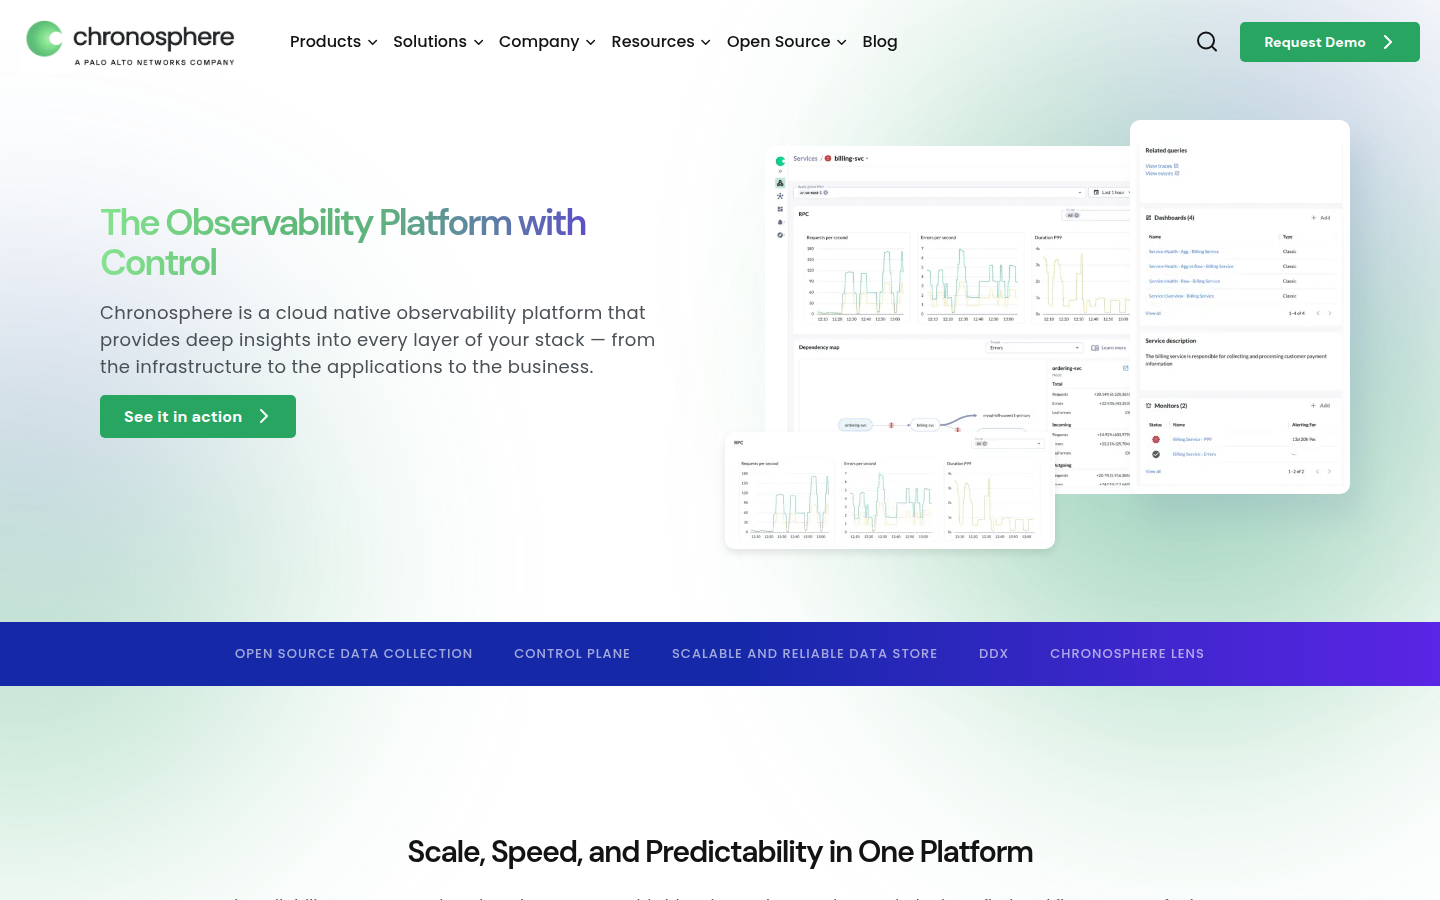
Chronosphere is the hyperscale control plane on this shortlist. The platform leads on ingest from Prometheus or OpenTelemetry, query with PromQL, and a Control Plane that shapes and transforms data so you do not store every raw point. Grafana dashboards and Prometheus Alertmanager alerts can come with you. Differential Diagnosis (DDx) is the guided path from a metric anomaly into traces. Chronosphere is owned by Palo Alto Networks (acquisition closed January 29, 2026).
Signals are metrics, traces, and logs. Chronosphere launched Logs 2.0 in June 2025 as part of a single platform that correlates logs with metrics, events, and traces. It also offers Logs powered by CrowdStrike (Falcon LogScale) to new and existing customers. Pricing is quote-only.
Best for: Platform teams whose Prometheus or OTel cardinality is already a budget and reliability problem.
Key features:
- Prometheus and OpenTelemetry ingest, PromQL query
- Control Plane to shape data before storage
- Logs 2.0 (and Falcon LogScale option), DDx from metric anomalies into traces, Grafana dashboard import
Why we like it: The Control Plane changes what gets stored, not only what shows up on a bigger bill, the right lever when cardinality is the failure mode.
Notable limitations:
- Quote only. There is no public list rate
- This is a control-plane purchase. Prefer a public-rate cloud if you need a self-serve start this week
- Wide-event debugging is Honeycomb’s job, not Chronosphere’s headline
Pricing: Quote. Contact Chronosphere. No public list rate.
Grafana Cloud
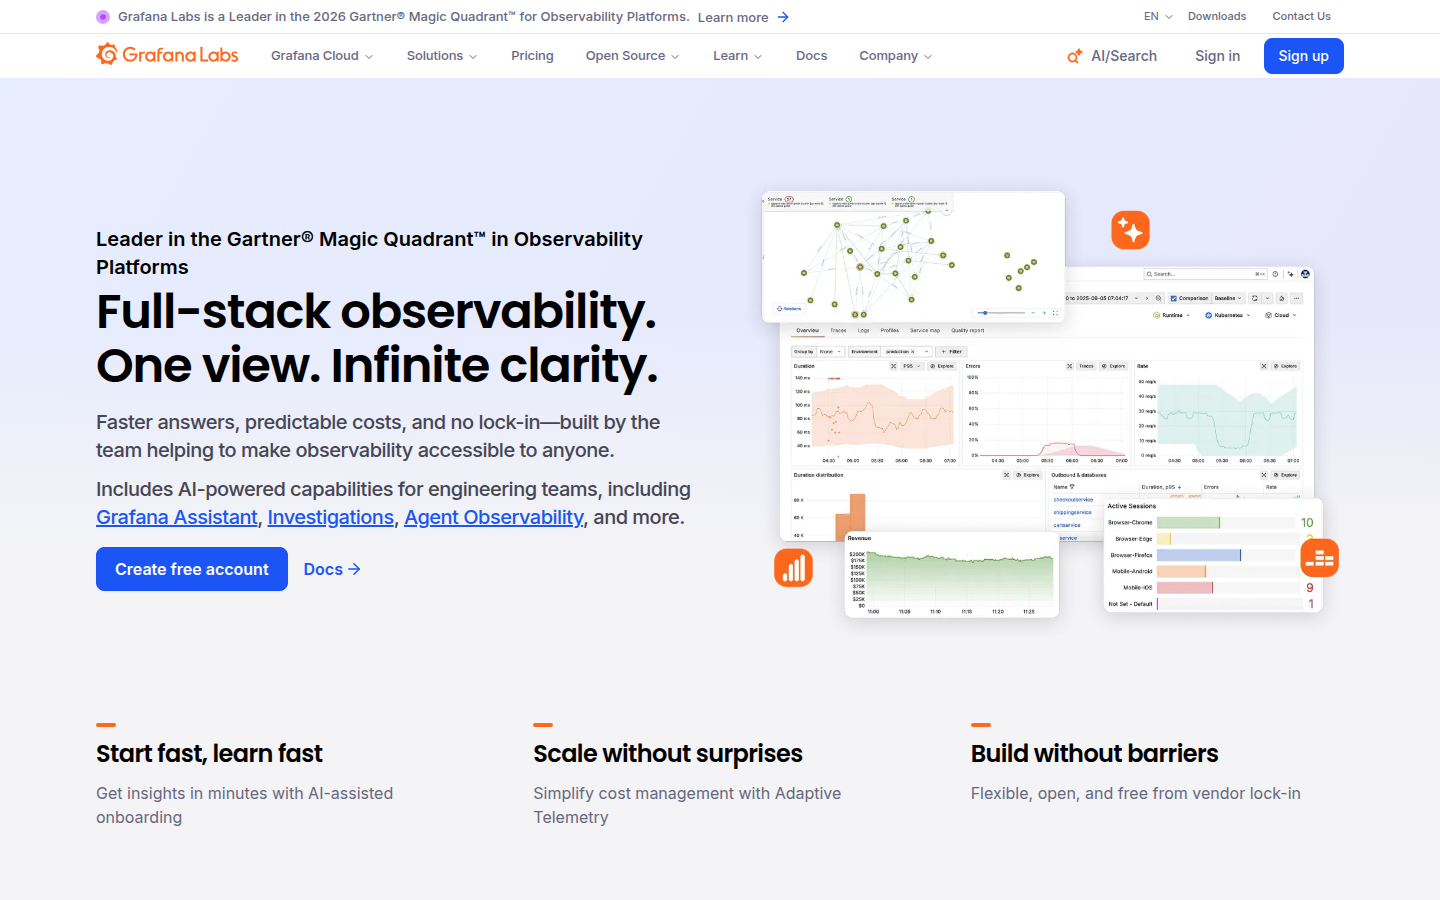
Grafana Cloud is Grafana Labs’ hosted path for the open LGT stack: Loki for logs, Grafana for dashboards, Tempo for traces, and Mimir for Prometheus-style metrics, with OTLP ingest. The Cloud product page calls the platform OpenTelemetry-native and leans on open standards so you can keep query languages (PromQL, LogQL, TraceQL) instead of a one-vendor dialect. Adaptive Telemetry is the cost-control story: keep the signals that matter, drop unused data.
Grafana Cloud is that open query path as a hosted tenant. Free has usage limits. Pro adds a $19 monthly platform fee plus public usage rates. Enterprise is a yearly spend commit.
Best for: Grafana shops that want Tempo, Loki, and Mimir as a hosted OTLP platform with open query languages.
Key features:
- OTLP on the Loki, Tempo, and Mimir path
- PromQL, LogQL, and TraceQL. Dashboards you can take back to OSS Grafana
- Adaptive Telemetry for volume, with Free, Pro, and Enterprise tiers
Why we like it: Queries and dashboards stay Grafana-shaped and portable when the alternative is rewriting every board into a vendor language.
Notable limitations:
- Hosted Cloud is not the same as running OSS Grafana, Mimir, Loki, and Tempo yourself
- Application Observability and other Cloud apps sit on this tenant. Quote the telemetry path you actually need
- Cardinality on metrics still drives the bill; Adaptive Metrics helps but does not erase a bad label set
Pricing: Free is $0, always, with usage limits and 14-day retention. Pro from $19 per month plus usage: metrics $6.50 per 1,000 billable series; logs $0.40/GB write + $0.05/GB processing + $0.10/GB monthly retention; the same three-part rate for traces. Retention on Pro: 13 months metrics; 30 days logs, traces, profiles, and k6. Enterprise from $25,000 per year spend commit.
Uptrace
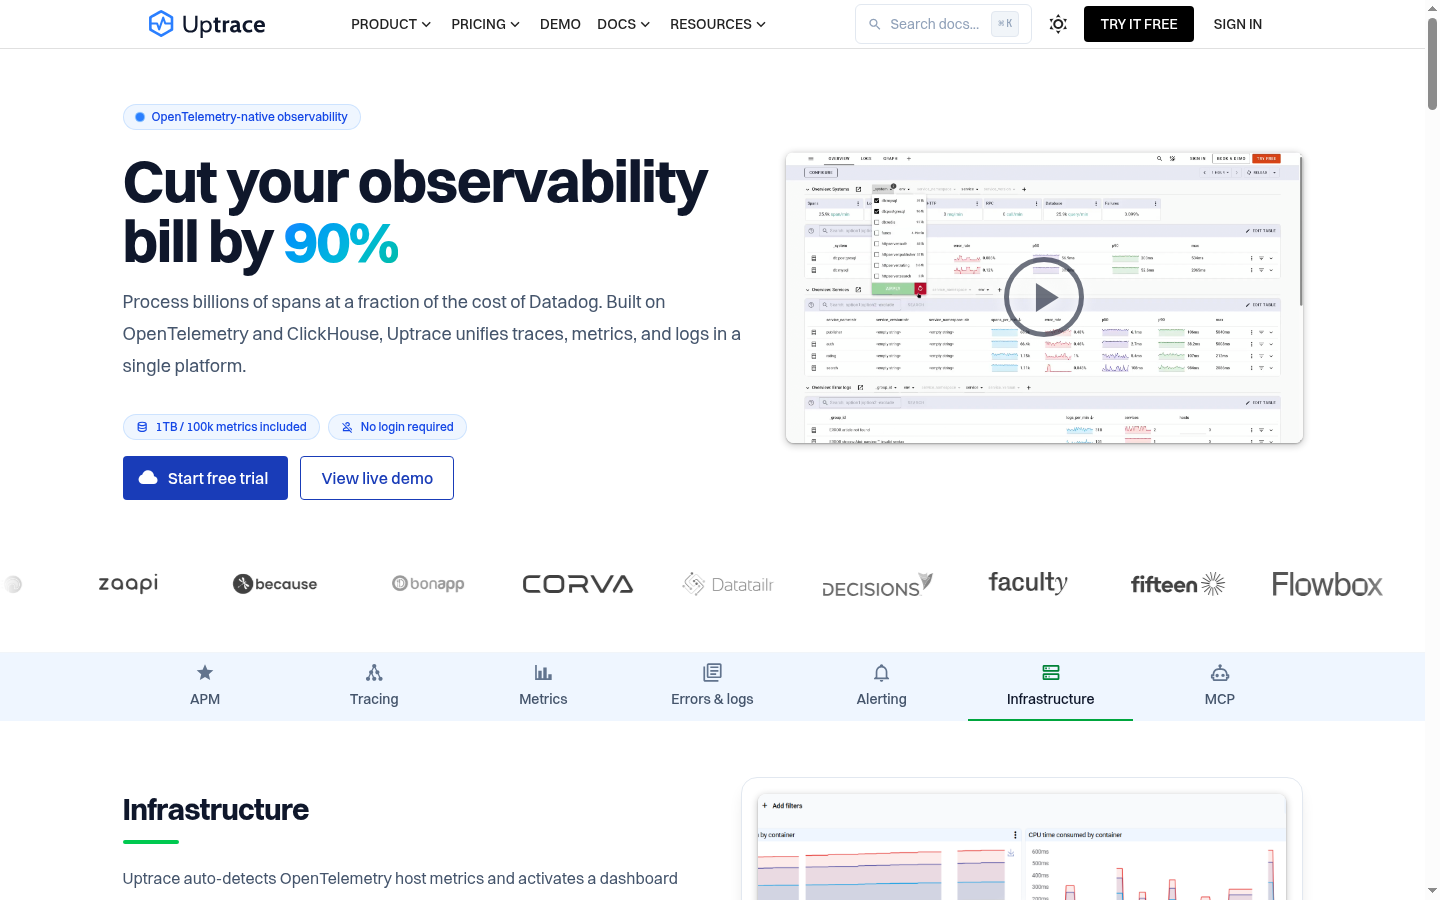
Uptrace is an OpenTelemetry-native observability platform on ClickHouse. It unifies traces, metrics, and logs, ingests OTLP (plus Prometheus and common log shippers), and sells on data volume, not seats or hosts. Cloud is fully managed. Community Edition is free self-host with no feature gates. On-prem licenses cover compliance installs.
The pitch is straightforward: ship OTel, keep a predictable per-GB / per-datapoint bill, and stay able to move the Collector to another store later. Default Cloud retention is 28 days; cold storage extends that.
Best for: Teams that want a pure OTel-native ClickHouse platform with published Cloud rates and a free self-host path.
Key features:
- OTLP ingest for traces, metrics, and logs on ClickHouse
- Service graphs, RED metrics, correlated signals, MCP query path
- Uptrace Cloud, free Community self-host, and on-prem licenses
Why we like it: The product is built as an OTel store first. Public volume pricing and a free Community edition make the greenfield path cheap to prove without a sales call.
Notable limitations:
- Cloud runs in Hetzner (Germany) with Finland backups. Model egress if your fleet is on AWS or GCP
- Default retention is 28 days; longer cold storage is a separate per-GB-month line
- Query surface is Uptrace’s UI, not a PromQL paste path like Dash0 or Grafana Cloud
Pricing: Cloud free up to 50 GB and 5,000 timeseries per month. Spans and logs from about $0.10/GB with automatic volume discounts (as low as $0.016/GB at scale). Metrics from $0.025 per million ingested datapoints, volume-discounted. No per-user or host fees. Community self-host is free. On-prem is a separate license.
New Relic
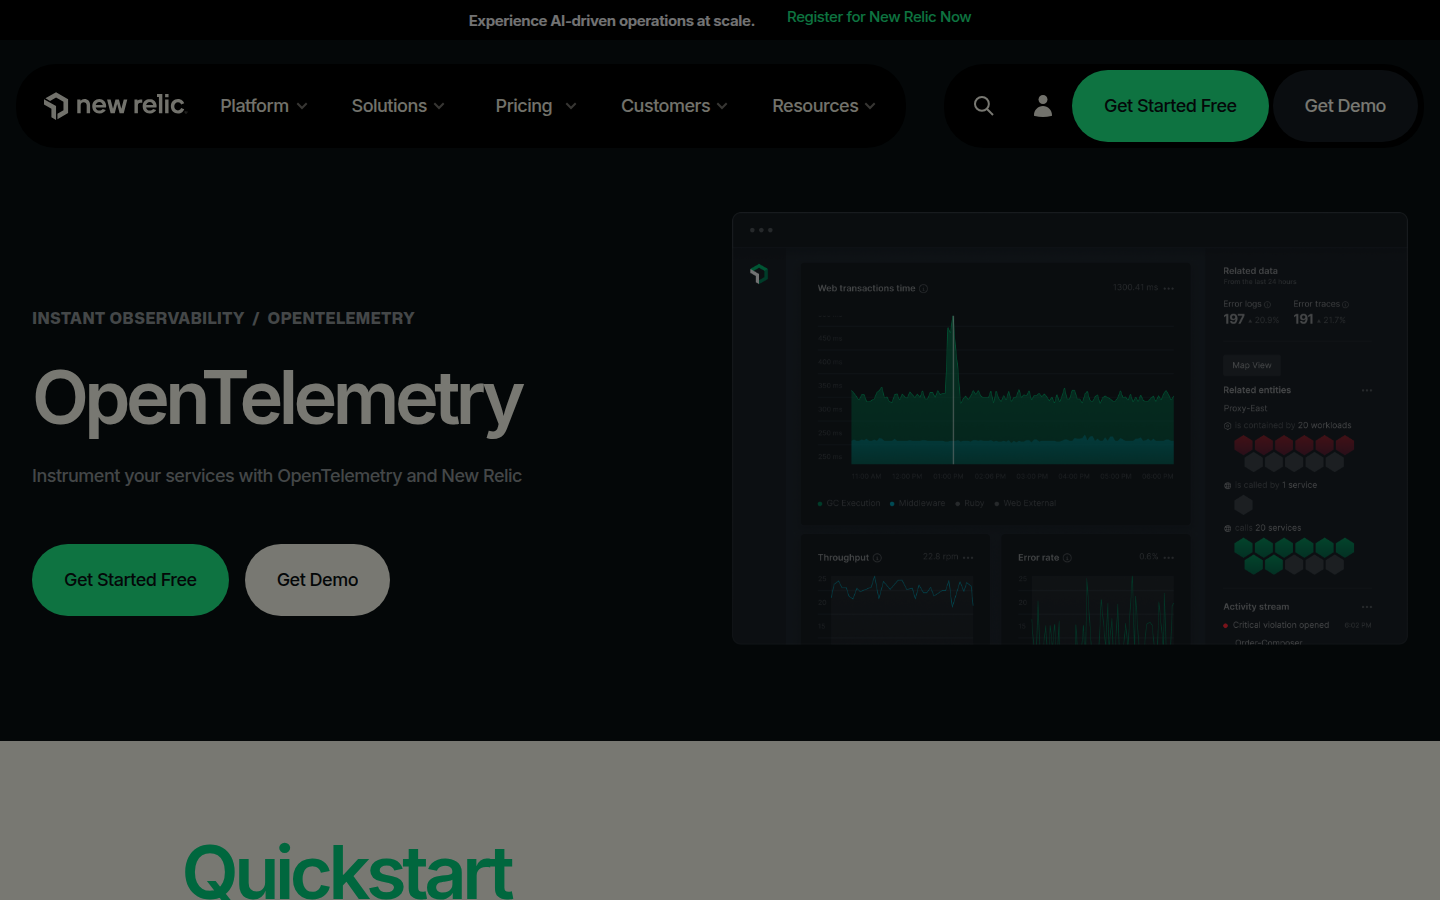
New Relic publishes a first-class OTLP path: send traces, metrics, and logs to the New Relic OTLP endpoint from OpenTelemetry SDKs or the Collector. Instant Observability and the public OpenTelemetry docs are the entry point. The same company still sells agents. OTLP ingest is real; the rest of the platform remains a New Relic store. Query is NRQL. Dashboards and alerts live in the New Relic console.
This is a full-stack platform that will take OTLP and publish a usage price, especially if that console is already the one on-call opens. Quote data ingest (and users or compute) for the OTLP path, not a second agent bundle you did not need.
Best for: Teams that want a documented OTLP path with public usage rates, and will live with NRQL and the New Relic console.
Key features:
- Native OTLP endpoint for traces, metrics, and logs
- Public OpenTelemetry docs and an Instant Observability quickstart
- Usage pricing on ingest, with user or compute editions on top
Why we like it: A Collector can export OTLP to a published endpoint without installing the New Relic agent first, which is useful when the rest of the org already has a New Relic login.
Notable limitations:
- New Relic still sells agents. OTLP support is not an OTel-only product path
- NRQL and New Relic dashboards are not PromQL. Exporting boards later is a project
- User editions and compute CCUs sit beside ingest. A cheap GB number is not the whole bill
Pricing: 100 GB ingest free per month, plus unlimited basic users and one free full platform user on the free tier. Original ingest $0.40/GB beyond that. Data Plus $0.60/GB. Core users from $49 per user on paid editions. Standard full platform users: $10 for the first user, then $99 each, maximum of 5. Pro: $349/user on annual or $418.80/user monthly pay-as-you-go. Compute pricing is offered as an alternative to user licenses.
OpenTelemetry-native platform features compared
| Platform | Signals | Cost control | OTel posture |
|---|---|---|---|
| Dash0 | Logs, metrics, traces (plus RUM, profiles, events on SignalStore) | SignalControl. Per-signal public rates | OTel-native store. Collector in |
| Honeycomb | Wide events / traces plus metrics volumes | Event plans. No attribute tax on the event price | Wide-event store on OTLP |
| SigNoz | Logs, metrics, traces on ClickHouse | Usage on Cloud. No host or user price | OTel-native. Cloud or self-host |
| Chronosphere | Metrics, traces, logs | Control Plane shaping. Quote | OTel and Prometheus ingest. PromQL store |
| Grafana Cloud | Logs, metrics, traces (Loki, Mimir, Tempo), plus profiles and k6 on Cloud | Adaptive Telemetry. Free then usage | OTLP on the open LGT path |
| Uptrace | Traces, metrics, logs on ClickHouse | Per-GB spans/logs; datapoints for metrics. Free tier | OTel-native. Cloud or self-host |
| New Relic | Traces, metrics, logs on the OTLP endpoint | Ingest GB plus users or compute | First-class OTLP. Agent products still sold |
How these platforms deploy and how you query them
| Platform | Deploy | Query languages | Dashboards and alerts |
|---|---|---|---|
| Dash0 | SaaS. Collector you run | PromQL, SQL, OpenTelemetry | Perses as code. PromQL rules / Alertmanager reuse |
| Honeycomb | SaaS (Private Cloud on Enterprise) | Honeycomb query | Triggers and SLOs in Honeycomb. Not PromQL paste |
| SigNoz | Cloud, BYOC on Enterprise, or Community self-host | Query builder, PromQL, ClickHouse SQL | In-product dashboards and alerts. As-code on Cloud |
| Chronosphere | SaaS control plane | PromQL | Grafana import. Alertmanager import |
| Grafana Cloud | Hosted Grafana Cloud. BYOC on Enterprise | PromQL, LogQL, TraceQL | Grafana dashboards and alerts. OSS-shaped |
| Uptrace | Cloud, Community self-host, or on-prem license | Uptrace UI; spans, metrics, and logs correlated | In-product dashboards and alerts. MCP query path |
| New Relic | SaaS | NRQL | New Relic console. Boards stay there |
Strategic Decision Framework
Four questions to ask before you buy. Stay inside this shortlist.
| Critical question | Why it matters | What to evaluate | Red flag |
|---|---|---|---|
| Do you need SaaS, or a cluster you operate? | Self-host is a staffing cost. SaaS is a bill. They fail in different weeks. | Name who will upgrade ClickHouse or Mimir after month three. If nobody, you want Cloud. | The plan is one engineer, nights, and “we will just run OSS.” |
| Is the query language PromQL (or SQL/TraceQL), or a proprietary dialect? | Boards and alerts are the lock-in, not the Collector YAML. | Paste a PromQL alert you already have. Watch whether it runs or gets rewritten. | The demo says OTLP ingest, then every chart is a vendor language with no export. |
| What happens when cardinality spikes? | OTel attributes are wide on purpose. A GB or custom-metrics tax will surprise you. | Ask how a new high-cardinality attribute is billed, dropped, or shaped. | The answer is “don’t send that label” with no Control Plane, SignalControl, or Adaptive path. |
| If you leave, do dashboards and alerts leave with you? | Instrumentation on OTLP is portable. Perses, Grafana JSON, and PromQL rules are portable. A vendor board often is not. | Export a dashboard and an alert rule in an open format during the POC. | Export is a screenshot, or the contract starts after the only query language is theirs. |
What usually goes wrong when buying an OpenTelemetry-native platform
Most mismatches happen because an OTLP ingest checkbox is treated as an OTel-native store, because the proprietary agent is cheaper to demo, or because cardinality is priced like a log warehouse.
| Problem | Solution |
|---|---|
| You treat OTLP ingest as OTel-native | Ask what the store and query language are. If the schema is still the vendor agent model with an OTLP adapter, you bought a different category |
| You pay proprietary-agent pricing you did not need | Instrument with the Collector and OTel SDKs. Quote the OTLP path. Do not add a proprietary agent because the trial wizard defaulted to it |
| Cardinality turns into bill shock | Pick a product that prices signals or events, or that shapes data before storage. Model a worst-week attribute set on the POC, not a quiet Tuesday |
Which OpenTelemetry-native platform should you pick
If this is a greenfield Collector and you want public rates, start with Dash0 for PromQL/Perses SaaS, SigNoz if you want ClickHouse in Cloud or a cluster you operate, or Uptrace for the same ClickHouse-native story with published per-GB Cloud rates. If the team already speaks Grafana, start with Grafana Cloud and keep PromQL, LogQL, and TraceQL.
If cardinality at Prometheus/OTel scale is the budget problem, start with Chronosphere’s Control Plane. If the job is high-cardinality debugging on wide events, start with Honeycomb and accept the query language. If New Relic is already the console, use the documented OTLP endpoint and skip a second proprietary agent on top of a Collector you already run.