Startup Stash is one of the world's largest online directory of tools and resources for startups
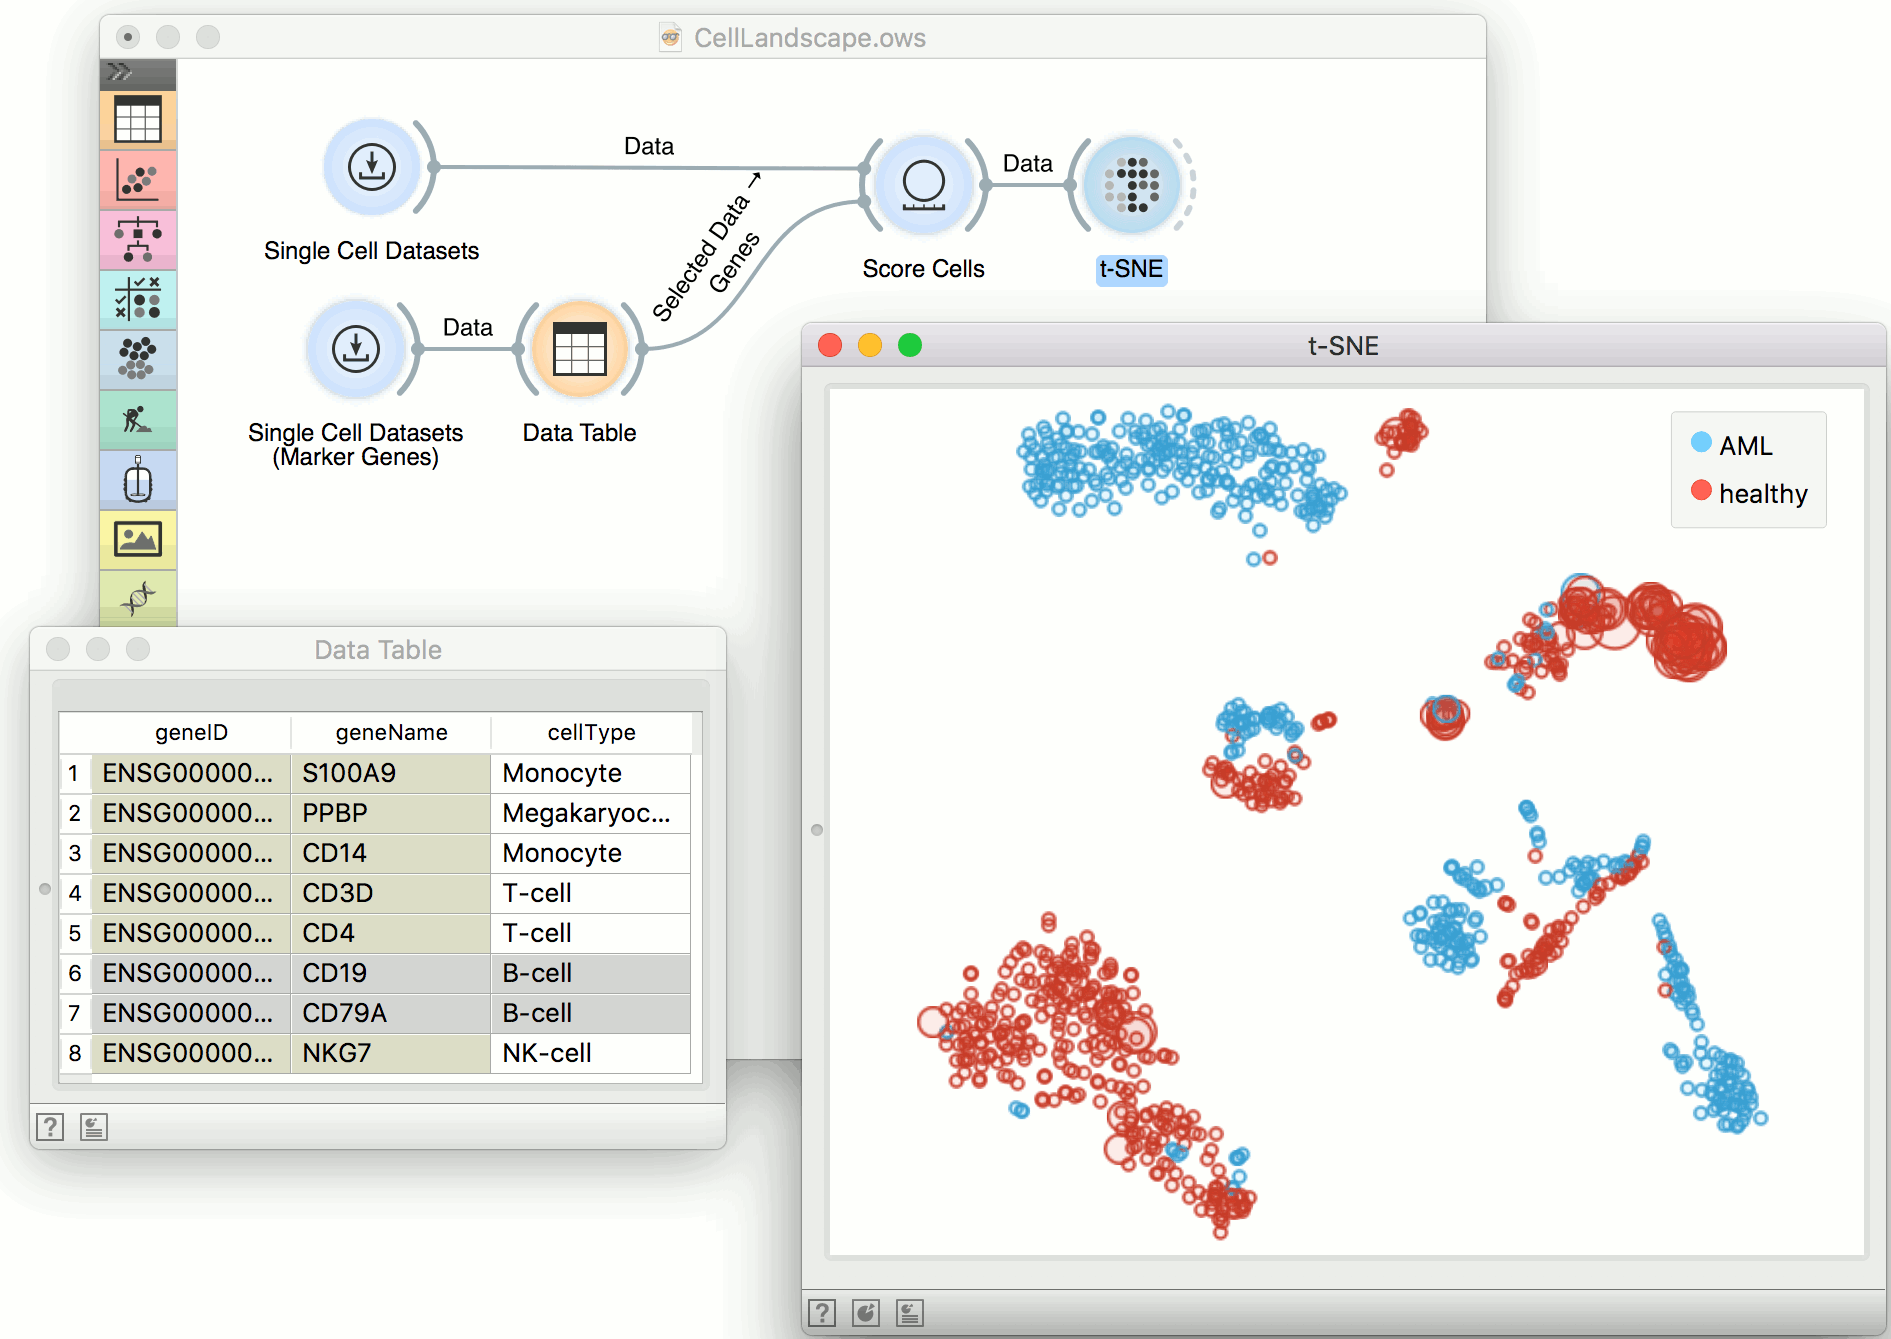
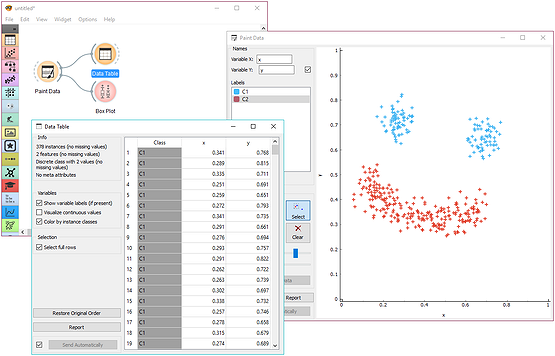
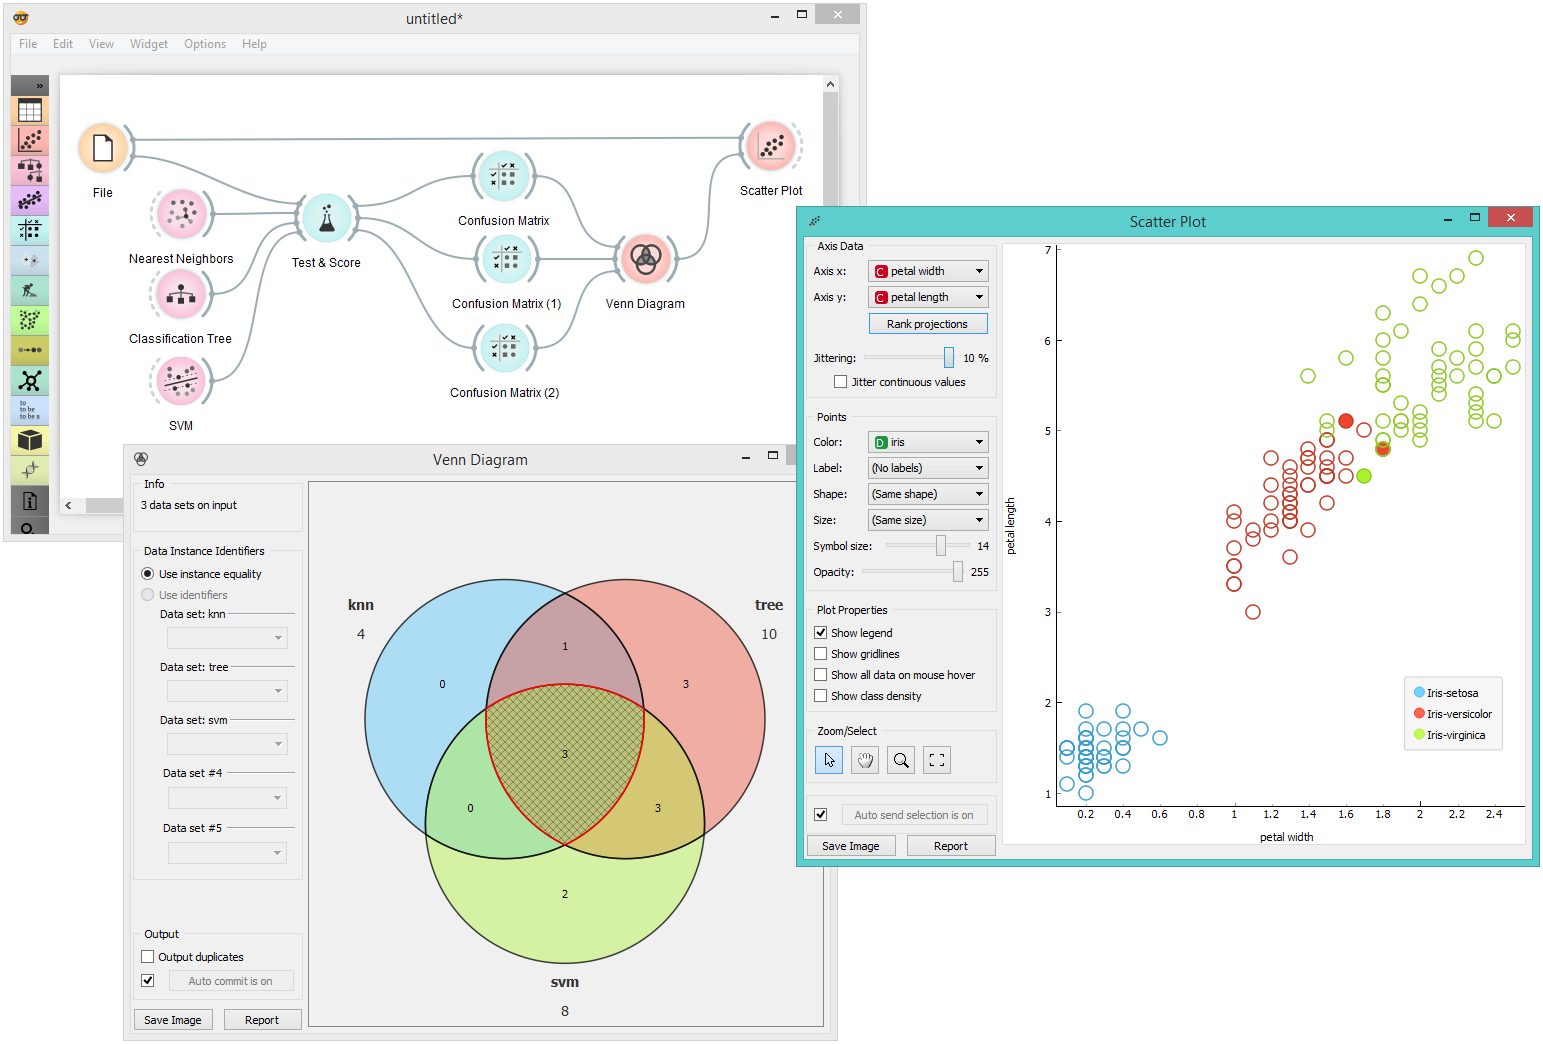
Workers can use the GUI to conduct data exploration and prototype-based qualitative analysis. In Orange, team members can use testing and training data to construct predictive analytics models. Hierarchical clustering and zoo data sets can be used by staff to infer phylogenetic relationships. Users can aggregate and alter the data using the pivot table feature, allowing them to compare financed and unfunded projects and see where the gaps lie.
 Create & Share Docs InstantlyManage Projects EasilyStartup DiscountsEfficient and IntuitiveIdeal for remote work and collaborationEasy to useEasy File Transfer and UploadingGreat InterfaceFast Upload, Transfer and Download speedFast and EffectiveEasy sharing of end resultsScreen recording and Narration
 The United Arab Emirates is the Middle East's most active startup hub, with tens of thousands of companies clustered in Dubai and Abu Dhabi. In...

Malaysia has matured into one of Southeast Asia's most watched startup bases, with Kuala Lumpur entering the top 20 of Startup Genome's emerging ecosystem ranking....
India is now the world's third-largest startup ecosystem, home to more than 130 unicorns and close to 700,000 registered companies. Bengaluru remains the country's primary...
The biggest online directory of tools and resources for startups
Contact us: Hello@startupstash.com
Subscribe to our weekly newsletter to receive the best tools, resources and discounts!
Advertise on Stash
Have a story?
 Verified